
Figure 4.
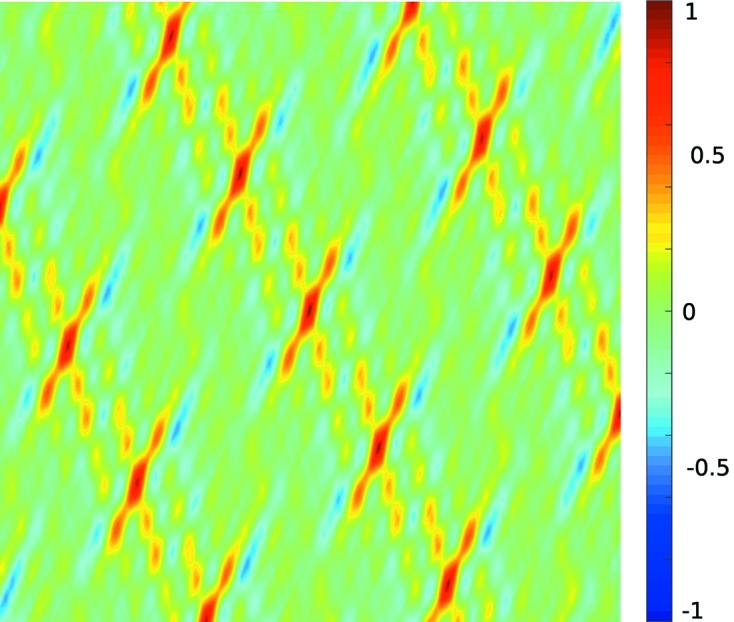
Score function for a set of 13 nodes that were generated by adding noise to the position of randomly chosen points on a lattice grid. For each node, positions on the lines are assigned a proximity of 1 and positions in the middle between two lines are assigned the proximity −1. The rest of the proximity function for a single node is a linear interpolation of these values. The score function is formed by the sum of the proximity functions of each node.