. 2019 Aug 30;75(Pt 5):694–704. doi: 10.1107/S2053273319010593
© Yaroslav Gevorkov et al. 2019
This is an open-access article distributed under the terms of the Creative Commons Attribution (CC-BY) Licence, which permits unrestricted use, distribution, and reproduction in any medium, provided the original authors and source are cited.
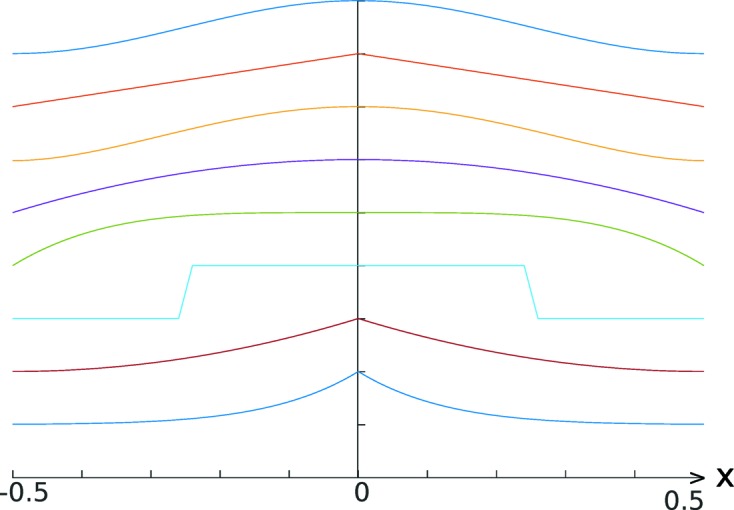
Figure 5.

Plotted proximity functions  (top) to
  (bottom).
