Figure 6.
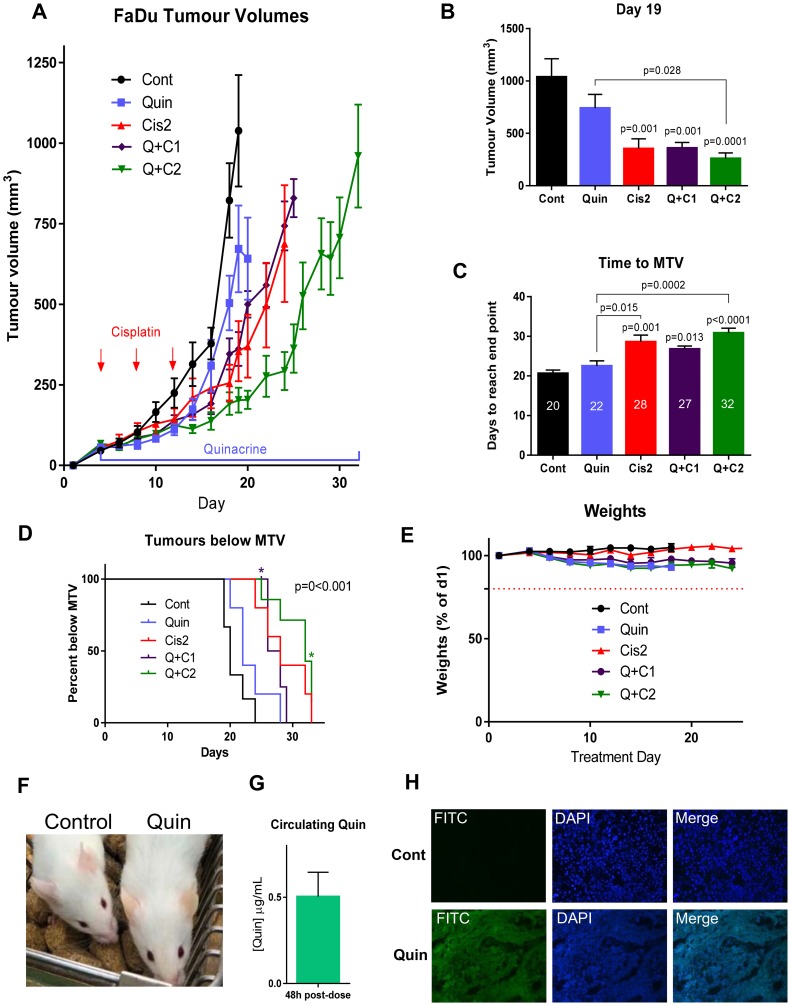
(A) Tumor growth in mice bearing FaDu tumors treated with 100 mg/kg quinacrine and or cisplatin (1 or 2 mg/kg, as indicated), n = 5–6 per group. (B) Tumor volumes on day 19 (n = 5–7 per group). (C) Time taken for tumors to reach maximum tumor volume (MTV) with median days for each treatment indicated on bars. (D) Kaplan-Meier plot showing the proportion of animals with tumors below MTV over time. *Star indicates a quinacrine + 2 mg/kg cisplatin animal being culled for reasons other than tumor size (n = 5–7 in each group). A log-rank (Mantel-Cox) test showed a significant difference between groups, represented on the graph. (E) Weights of mice over the experiment. (F) Slight yellowing of the skin caused by quinacrine treatment (right) next to a vehicle-treated animal (left). (G) Concentrations of quinacrine in mouse plasma 48 hours post-gavage treatment on day 19 of treatment (n = 5). (H) Cross sections of representative tumor sections taken at the end of the experiment from vehicle and quinacrine-treated mice showing autofluorescence in the FITC channel of cells incorporating quinacrine into their DNA (n = 3).

