
Figure 2.
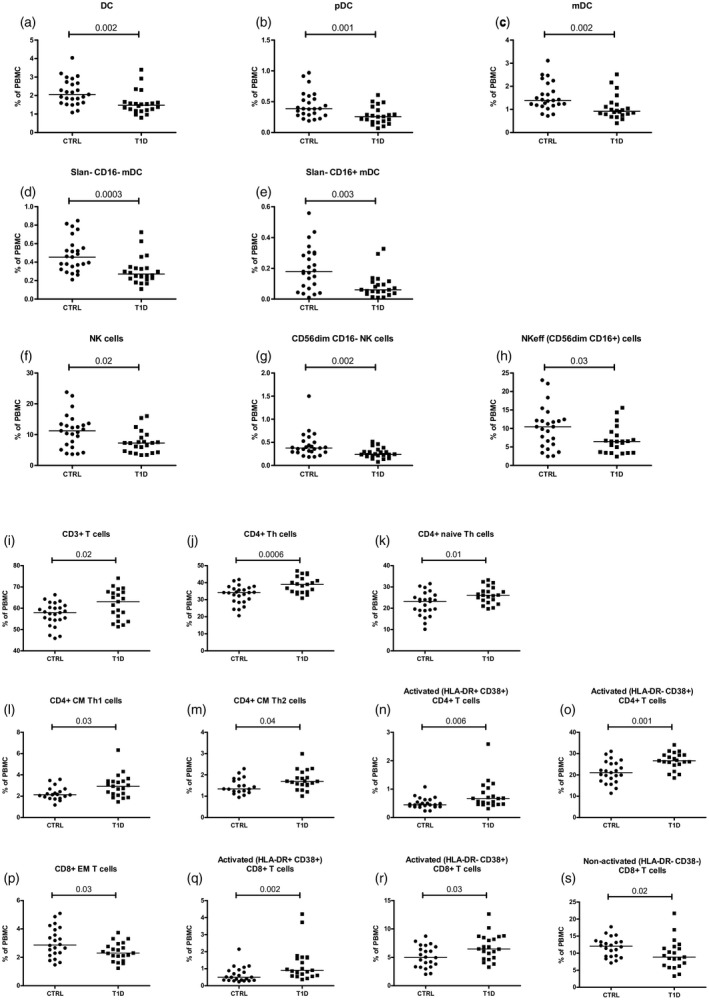
The following immune cell frequencies in type 1 diabetes (T1D) patients differed significantly from controls (CTRL): (a–e) dendritic cell (DC) compartment; (f–h) natural killer (NK) cells and its subsets; and (i–s) many subsets in T cell compartment. Each data point represents an individual subject. Horizontal lines indicate median values of cell frequencies; P‐values ≤ 0.05 were considered statistically significant in the Mann–Whitney U‐test.