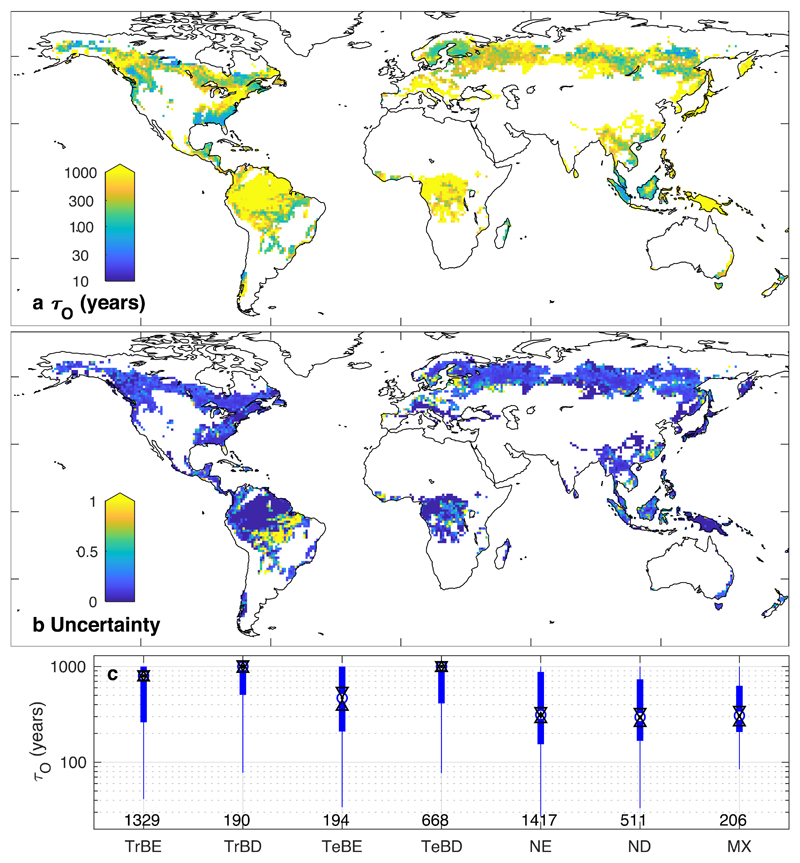
Figure 1. Forest disturbance rotation periods.
a, τo calculated over 2000-2014. b, Uncertainty in τo, displayed as the difference between the 95% confidence intervals divided by the central estimate. Uncertainty values of zero reflect 95% confidence that τo is over 1000 years. c, Boxplot of τo grouped by forest type (see Methods for codes). Circles show the median value, black triangles the 95% confidence limits of the median, thick lines the interquartile range and whiskers extend to a maximum of 1.5 times the interquartile range. Numbers indicate the number of grid cells for each forest type.

