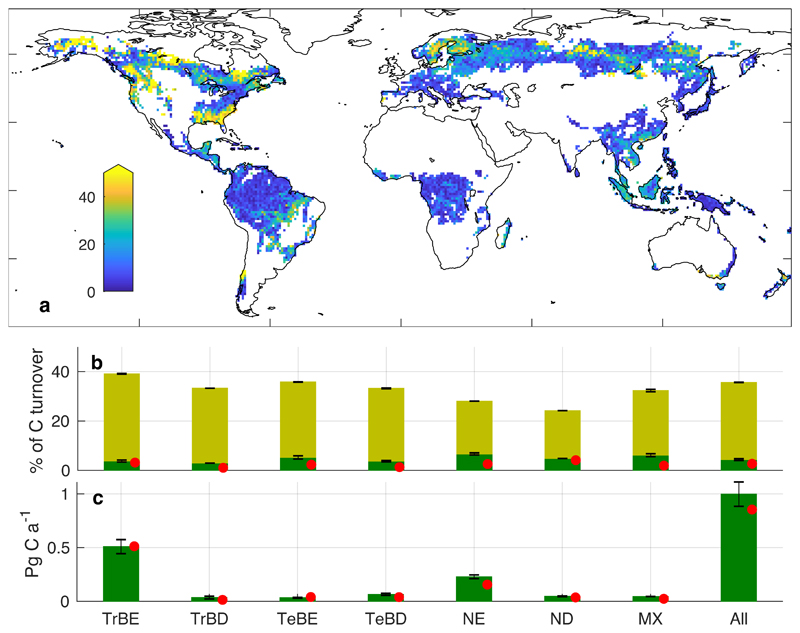
Figure 2. Carbon turnover fluxes from closed-canopy forest for 2001-2014.
a, Fraction of carbon turnover fluxes resulting from vegetation mortality due to stand-replacing disturbances (colour scale capped at 50%), calculated using τo to drive LPJ-GUESS. Breakdown by forest type of: b, fraction of carbon turnover fluxes resulting from vegetation mortality (whole bars) and from stand-replacing disturbances (darker shading); c, total turnover flux of vegetation carbon due to stand-replacing disturbance. Error bars show the range of simulations driven by the 95% confidence intervals of τo. Red dots show results from an observationally-based cross-check method (Methods). Forest types as in Fig. 1.

