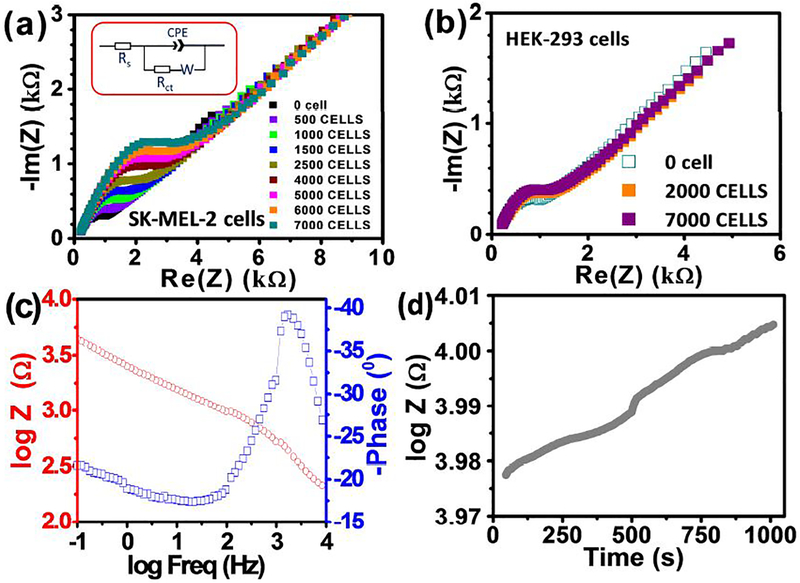
Fig. 2.
Nyquist plot for the MC1R-Ab-PANI/SPE electrode recorded in the frequency range of 0.1 Hz to 10 kHz at a standard potential of +0.15 V, using a sinusoidal potential perturbation of 5 mV amplitude in 0.1 M KCl solution containing 5 mM [Fe(CN)6]3−/4−, with different concentrations of (a) SK-MEL-2 cells and (b) HEK-293 cells. (c) Bode plot for the electrode recorded in the frequency range of 0.1 Hz to 10 kHz at a standard potential of +0.154 V, using a sinusoidal potential perturbation of 5 mV amplitude in 0.1 M KCl solution containing 5 mM [Fe(CN)6]3−/4−. (d) Single frequency impedance profiling results of 1000 SK-MEL-2 cells.

