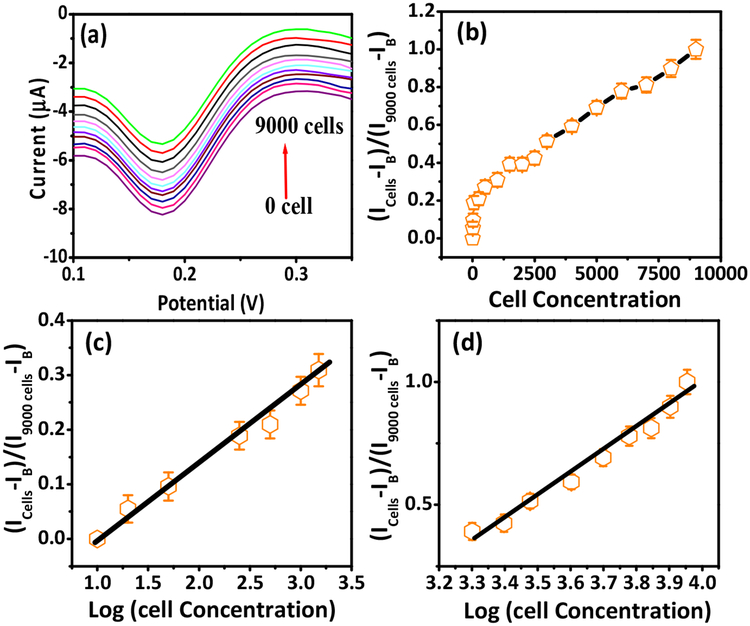
Fig. 4.
(a) DPV curves with different SK-MEL-2 cell loads from 0 to 9000 cells/10 mL at MC1R-Ab-PANI/SPE (200 ng Ab loading). (b) Peak current ratio versus SK-MEL-2 cell concentration. Calibration curves of peak current ratio vs logarithm of SK-MEL-2 cell load: (c) 10 to 1000/10 mL and (d) 2000 to 9000/10 mL.

