
Fig. 1.
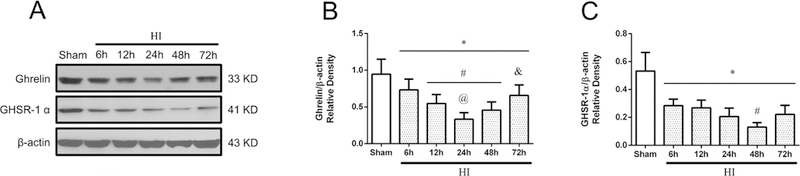
Temporal expression of endogenous Ghrelin and GHSR-1α in the brain after HI. (A) Representative pictures of western blot data. (B) Western blot data analysis showed that endogenous ghrelin expression levels significantly decreased in a time-dependent manner from 6 h to 72 h reaching the lowest point at 24 h post HI. (C) Western blot data analysis showed that endogenous GHSR-1α expression levels significantly decreased in a time-dependent manner from 6 h to 72 h reaching the lowest point at 48 h post HI. *P < 0.05 vs. Sham; #P < 0.05 vs. 6 h HI; @P< 0.05 vs. 12 h HI; &P < 0.05 vs. 24 h HI. Data are represented as mean ± SD, n= 6 for each group.