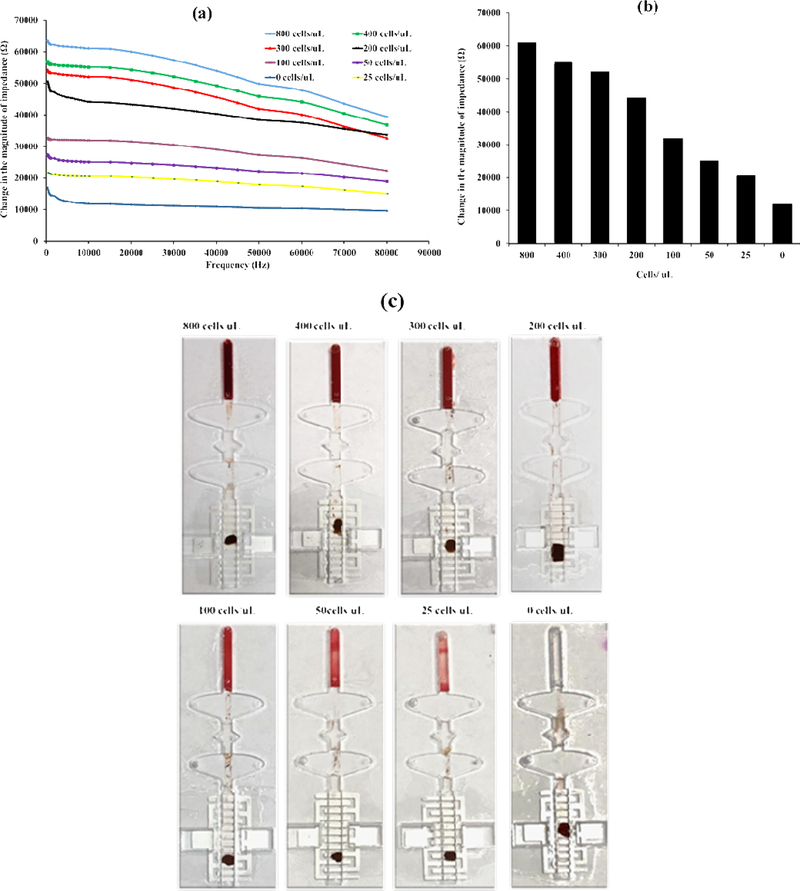
Figure 5.
(a) Change in the magnitude of impedance vs frequency graphs for various concentrations of CD4+ T cells. (b) Change in the magnitude of electrical impedance for various concentrations of CD4+ T cells at 10 kHz. (c) Images of the microfluidic chips after the successful completion of the immunoassay.

