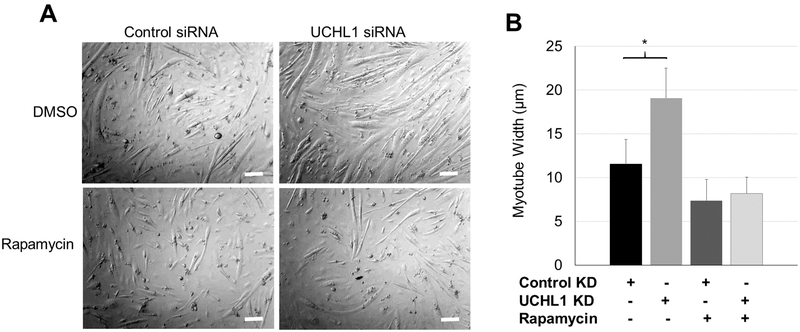
Figure 5: Rapamycin abolishes UCHL1-induced myotube hypertrophy.
(A) Phase-contrast images of 3-day differentiated C2C12 myotubes treated with control or UCHL1 siRNA with DMSO or rapamycin. The scale bar = 50 μm (B) Quantification of myotube width of each group. “*” indicates p<0.05 as compared between the control and UCHL1 KD group (genotype effect), by two-way ANOVA followed by t-test; n=40, 37, 32, and 30 for control+DMSO, UCHL1 KD+DMSO, control+rapamycin, and UCHL1 KO+rapamycin from 3 independent dishes per group, respectively.

