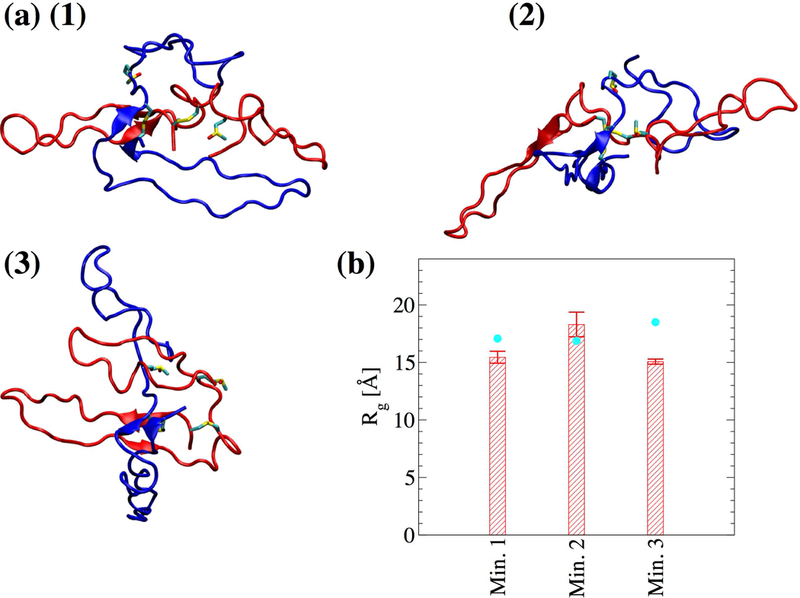
Figure 7. Representative dimer conformations from the local minima of the FEL shown in Figure 5b.

(a-c) Met(O)476 and the disulfide bond Cys442Cys472 are shown in stick and ball representation. Monomer 1 is colored in blue and monomer 2 is colored in red. (d) The radius of gyration of the dimer computed from the last 40 ns of the in total 50-ns simulations. Cyan circles correspond to the radius of gyration of the dimer of the representative frame in each bin. Error bars represent the standard deviation.
