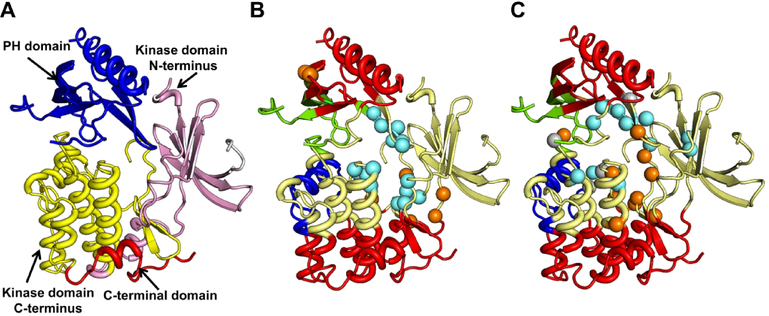
Figure 12.
AKT 1 (PDB 3O96) domains, communities and predictions. (A) The three major domains of AKT 1 are shown. The kinase domain is split into its respective N and C-terminus domains and these four parts are shown in different colors. Experimentally reported (B) and top 15 AR-Pred predicted (C) allosteric and active site residues are shown. The protein backbone is colored based on its division into the computed four dynamic communities. Regions in the same color show highly correlated motions, indicating these are the rigid elements in the protein’s dynamics. The allosteric residues are in cyan, the active site residues in orange. In the predictions made by AR-Pred, residues which were predicted both as allosteric and active sites are shown in gray.

