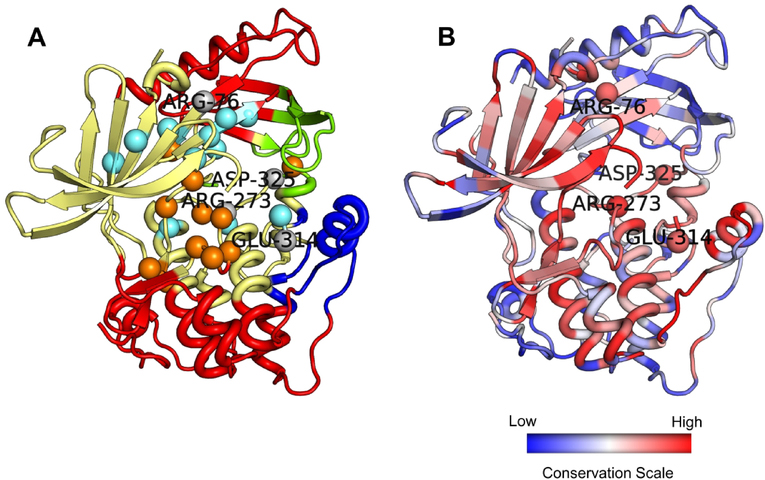
Figure 13.
Overlap between allosteric and active site residue predictions. (A) Four residues predicted by AR-Pred to be both allosteric and active site are shown in gray and labelled. The coloring scheme is same as in Fig. 12. (B) The protein is colored by its evolutionary conservation, with the color scale varying from blue to red – least conserved to most conserved.

