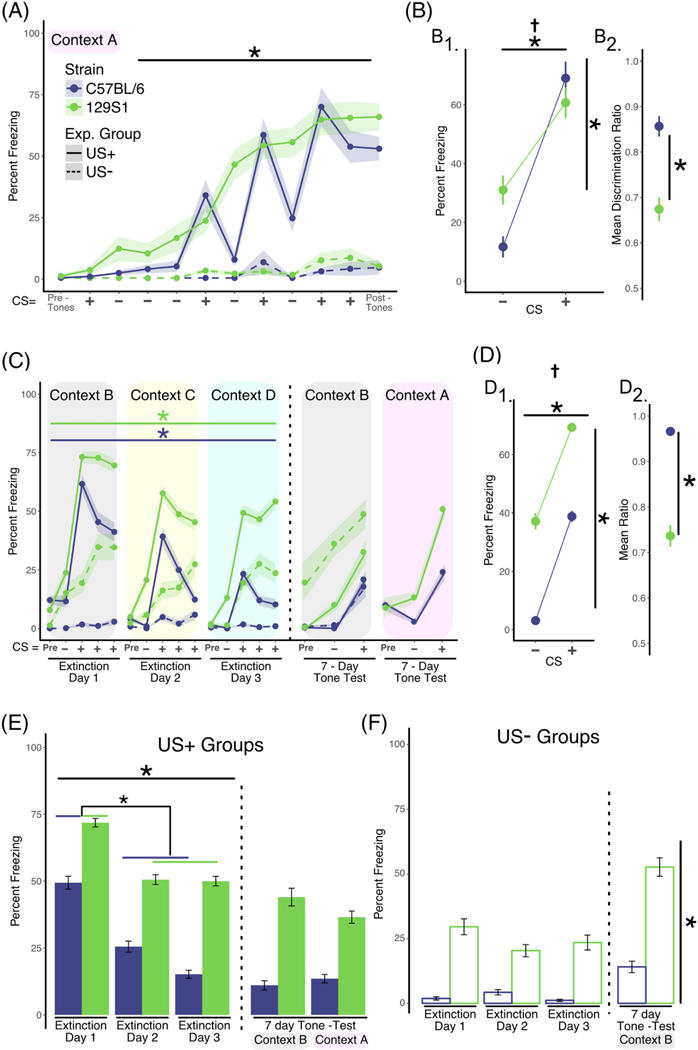
FIGURE 4.

Presentation of unpaired CS+ tones in novel contexts during extinction training enhances the consolidation of extinction learning across training sessions. A, Analysis of training data. Two separate groups of mice were used in this experiment. Mice in the US+ group (solid lines, C57BL/6 n = 17 [10 males; 7 females], 129S1 n = 22 [11 males; 11 females]) were exposed to discontinuous or pipped auditory stimuli that consisted of white noise (CS−; 200-ms white noise pips, delivered at 1 Hz for 25 seconds) or 4-kHz pure tone (200-ms pips, delivered at 1 Hz for 25 seconds), which coterminated with a foot shock (CS+). Mice in the US− group (dashed lines, C57BL/6 n = 8, 129S1 n = 8) received the identical auditory stimuli but did not receive the foot shocks. Mice in the US+ group exhibited increased freezing across the training session (repeated measures ANOVA; effect of training, P < .001) independent of strain. In the absence of shock, mice in the US− group did not exhibit significant levels of freezing. B, Analysis of discrimination learning during training. The mean percent freezing averaged across all CS+ presentations during training was significantly greater in both strains when compared with the mean freezing in response to the CS− presentations (B1, 2-factor ANOVA; effect of CS, P < .001). However, calculation of the discrimination ratio showed that C57BL/6 discriminate CS+ and CS−better than 129S1 mice (B2, unpaired t test, P < .001). C, Analysis of within-session extinction learning. Twenty-four hours following training, mice in both groups were exposed to four CS− stimuli followed by 12 CS+ presentations (displayed in bins of four stimuli) in a novel context each day of extinction training (context B, C, D) for 3 days (extinction days 1–3). For both strains, repeated exposure to the CS+ tone in the US+ group resulted in significantly less freezing within extinction training sessions using separate repeated measures ANOVA per strain; effect of bin, P < .01). D, Analysis of tone discrimination during extinction. Mice in both strains exhibited significantly more freezing when exposed to the CS+ tone (D1, 2-factor ANOVA; effect of CS, P < .001). However, the C57BL/6 showed significantly better CS discrimination compared to the 129S1 strain when the discrimination ratio was calculated (D2, unpaired t test, P < .0001). E, Analysis of extinction across days (US+ Group). Freezing across extinction days was analyzed by calculating the mean percent freezing for the three binned CS+ presentations for each of the three extinction days, each in a novel context (solid line in panel C). Statistically significant reductions in freezing were observed for both C57BL/6 and 129S1 mice across training sessions (main effect of training session, P < .0001). Post-hoc analysis confirmed that there were significant differences in freezing between extinction day 1 and extinction days 2 and 3 for both strains (lower asterisk, P < .01). To determine to what extent extinction learning was retained long-term, mice in both strains were randomly segregated into two groups and freezing during CS+ and CS− presentations was measured in either context B or context A (the training context) 7 days after extinction training (data to the right of the dotted line in Figure 4E). When tested 7 days after the last day of extinction training mice in both strains exhibited freezing levels that were indistinguishable from extinction training day 3, regardless of context or strain. F, Analysis of freezing in the US− group across days. Freezing in the US− group was calculated each day as the mean percent freezing measured during the CS+ tone presentations (dashed line in panel C). The 129S1 mice exhibited increased “freezing” across the 3 days of re-exposure to the CS+ tone compared with the B6 strain (P < .0001), in spite of the fact that they never received the foot shock. Data shown as sample mean with shaded region or bars representing the SE of the mean. Asterisk (*) denotes statistical significance for main effect of training (horizontal line) or strain (vertical line) and a dagger (†) for significant interaction between main effects. Data are presented as mean ± SEM
