
Figure 5.
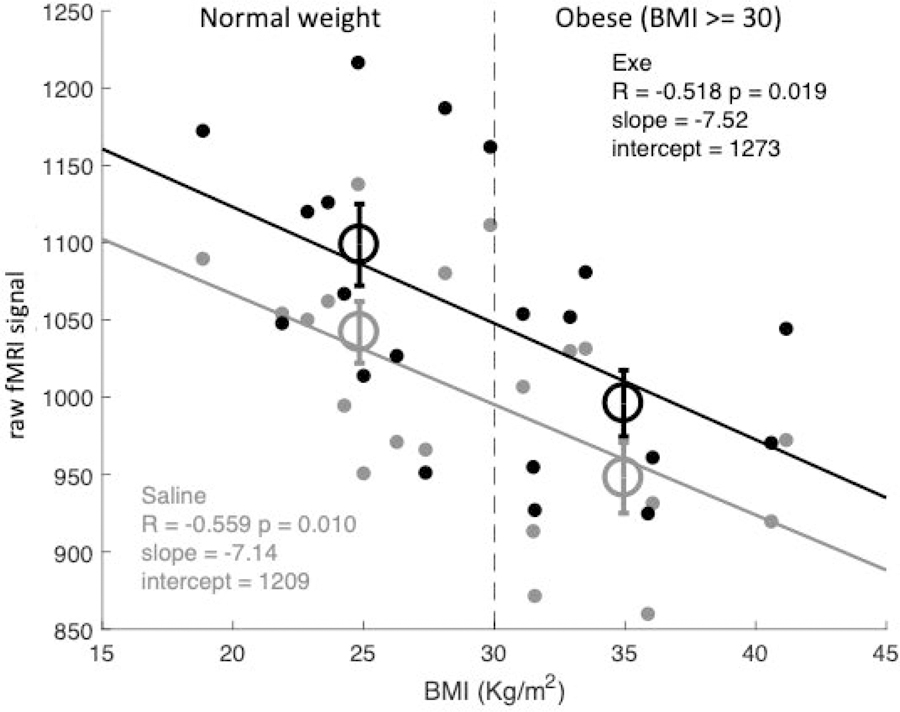
Raw fMRI signal at rest plotted against each subject’s BMI, separately for the saline and exenatide conditions (implying two data-points per participant, gray and black respectively). The vertical dashed line shows the cut-off used to define the dichotomic factor obesity (BMI >= 30). Open circles give the average BOLD signal in lean and obese individuals (different abscissas) in the saline and exenatide conditions (gray and black respectively). Text insets give Pearson’s correlation coefficients (R) with associated p-values, and the parameters of the linear fit through the data, separately for the two conditions (gray and black text for the saline and exenatide conditions).