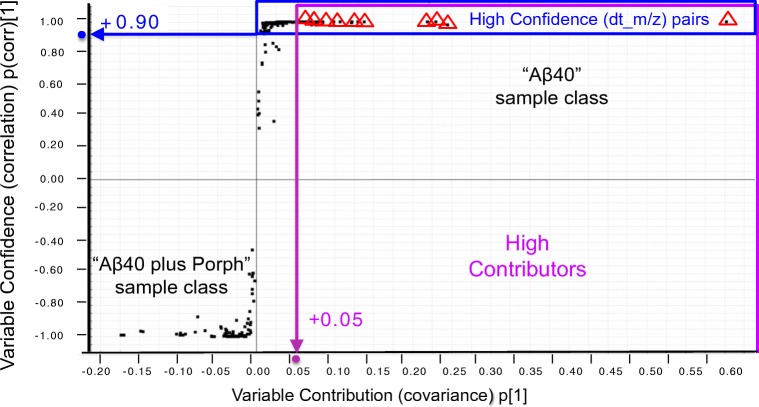
Fig. 4.
Representative S-plot of OPLS-DA model separating peptide profiles of “Aβ40” class and of the “Aβ40 plus Porph” class. The upper right quadrant of the S-plot shows those features which are elevated in “Aβ40” control group, while the lower left quadrant shows the pairs elevated in “Aβ40 plus Porph” class. The farther along the x-axis, the greater the contribution to the variance between the groups, while the farther the y-axis, the higher the reliability of the analytical result. The points are the features (drift time_ m/z pairs). dt_m/z marker pairs are selected based on their intra-class intensity variability, measured by the correlation parameter, p(corr)[1], as well as based on their contribution to the inter-class separation measured by the covariance parameter, p[1] shown in S-plot. p(corr)[1] > + 0.9 and p[1] > + 0.05 was employed as the threshold confidence interval

