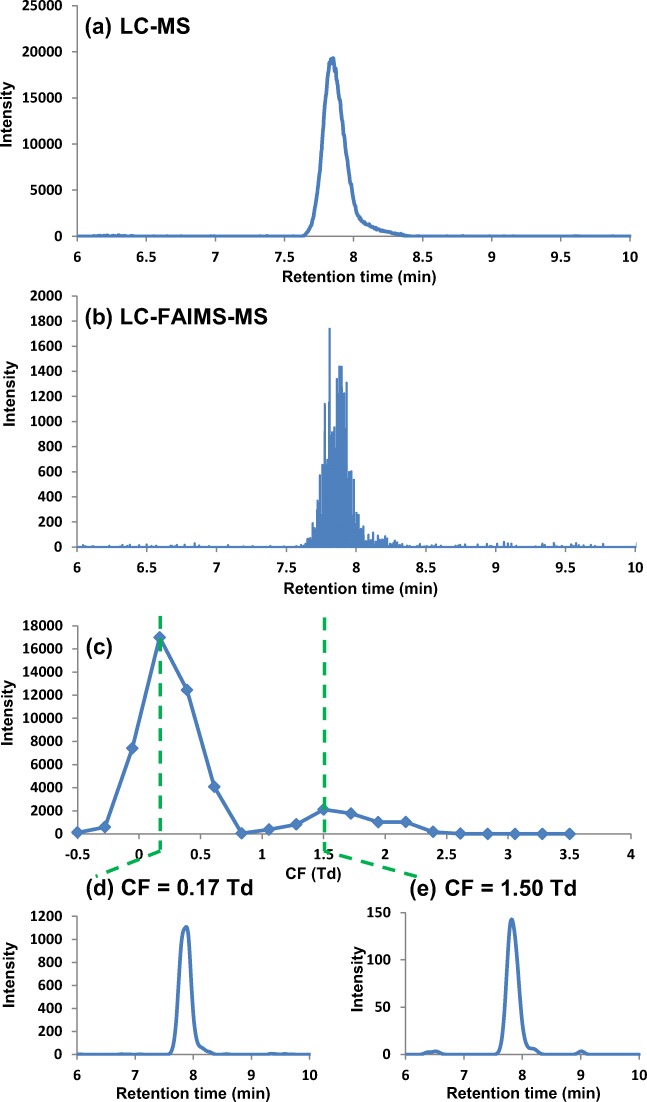
Fig. 2.
(a) LC-MS extracted ion chromatogram (m/z 137.071) for urine, (b) LC-FAIMS-MS extracted ion chromatogram (m/z 137.071) for the same urine sample over the full CF range, (c) CF spectrum (CF − 0.5 to 3.5 Td) and (d) extracted ion chromatograms (m/z 137.071) at CF 0.17 Td (lower left) and at (e) CF 1.5 Td (lower right)

