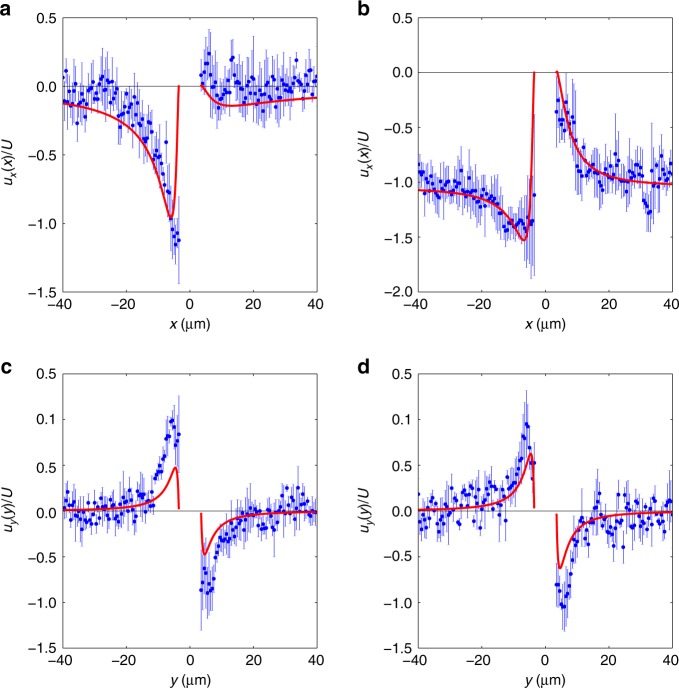
Fig. 4.
Two components of the velocity field. x-component of the velocity measured at y = 0 and as a function of the coordinate x for the two situations where the swimmer is stuck (a) and freely moving (b). y-component of the velocity measured at x = 0 and as a function of the coordinate y for the two situations where the swimmer is stuck (c) and freely moving (b). For all plots, the blue symbols and error bars are obtained experimentally after averaging the fields measured in a stripe of width 2 μm around y = 0 (a, b) and x = 0 (c, d). The red line is a fit of the experimental data using the expressions of the velocity given in the Methods section (Eqs. (15) and (17)), with K = v0/U as a free parameter. The expansions in Legendre polynomials are truncated at order N = 25. The values of the fit parameters are Kstuck = 11.6 ± 0.7 and Kmoving = 15.2 ± 0.7

