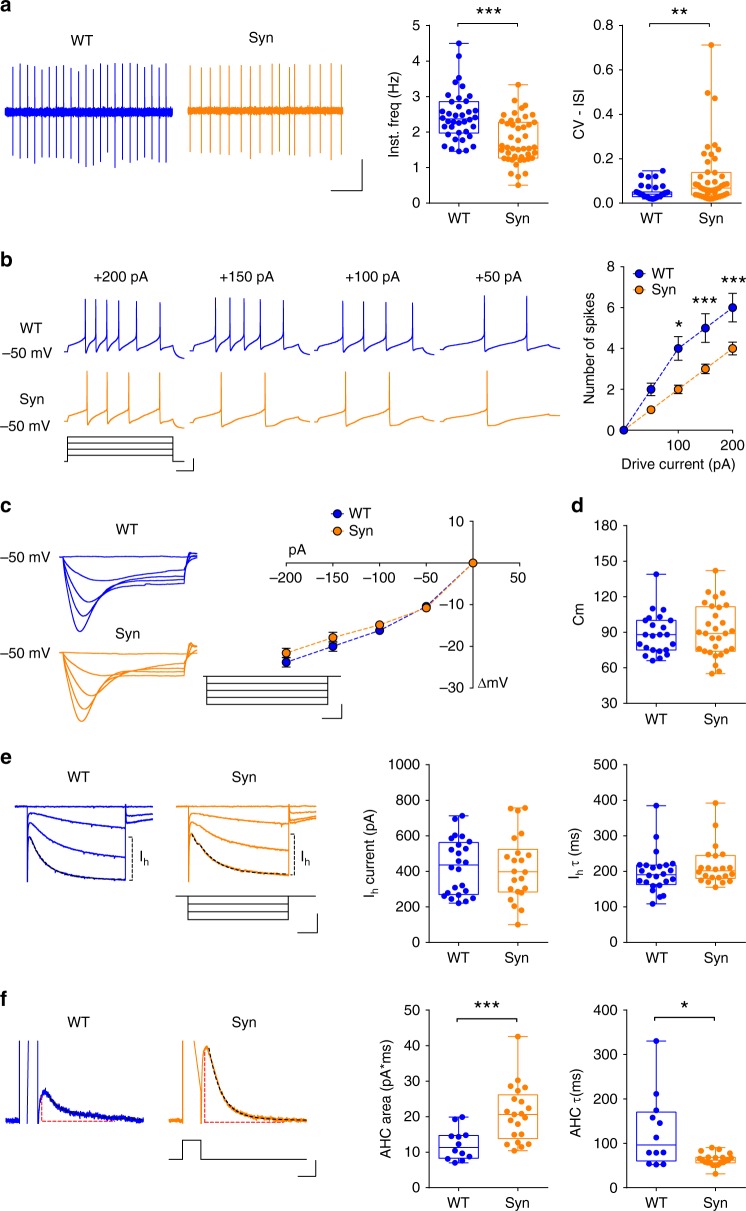
Fig. 2.
Altered DA neuron electrophysiological properties in 4-month-old Syn rats. a Spontaneous firing in SNpc DA neurons from 4-month-old rats (scale: 2 min, 0.2 mV) and plots showing firing frequency (38 cells from 10 WT, 47 cells from 11 Syn; Mann–Whitney test, ***P < 1.00 × 10⁻⁴) and coefficient of variation of interspike interval (35 cells from 10 WT, 45 cells from 11 Syn; Mann–Whitney test, **P = 0.002). b APs induced by depolarization (scale: 100 ms; 20 mV, 100 pA) from DA neurons held at −50 mV and mean (±s.e.m.) AP numbers (11 WT, 10 Syn neurons, 3 rats each; two-way repeated-measures ANOVA: genotype×current, F4,76 = 9.36, P < 1.00 × 10⁻⁴; current, F4,76 = 116.6, P < 1.00 × 10⁻⁴; genotype, F1,19 = 10.76, P = 0.004. WT vs Syn: 200 pA ***P < 1.00 × 10⁻⁴, 150 pA ***P = 4.00 × 10⁻⁴, 100 pA *P = 0.036, 50 pA P = 0.221 with Bonferroni’s). c Sub-threshold responses to hyperpolarization (scale: 100 ms; 10 mV, 100 pA) and current/voltage plots (±s.e.m.; 11 WT, 10 Syn neurons, 3 rats each; two-way repeated-measures ANOVA: genotype×current, F4,76 = 1.64, P = 0.172; current, F4,76 = 362.9, P < 1.00 × 10⁻⁴; genotype, F1,19 = 1.26, P = 0.276. WT vs Syn: 0 pA P > 0.999, −50 pA, P > 0.999, −100 pA, P > 0.999, −150 pA, P = 0.496, −200 pA, P = 0.411 with Bonferroni’s). d Cm (23 WT, 29 Syn neurons, 5 rats each: Welch’s t-test P = 0.638). e Ih currents from DA neurons held at −60 mV and hyperpolarized in 20 mV increments (scale: 200 ms; 50 mV, 200 pA). The activation phase was fitted to 1–2 exponentials (dash line). The plots show Ih amplitude and weighted activation tau after hyperpolarization to −120 mV (24 WT, 22 Syn neurons, 8 rats each; amplitude: Welch’s t-test P = 0.886; tau: Mann–Whitney test P = 0.342). f AHC (scale: 100 ms; 50 mV, 50 pA), induced by depolarization to 0 mV. AHC trace area is designated by red dash lines and deactivation is obtained with exponential fits (12 WT, 21 Syn neurons, 4 rats each; area: Welch’s t-test ***P = 3.00 × 10⁻⁴; tau: Mann–Whitney test *P = 0.013). Source data are provided as a Source Data file

