Fig. 4.
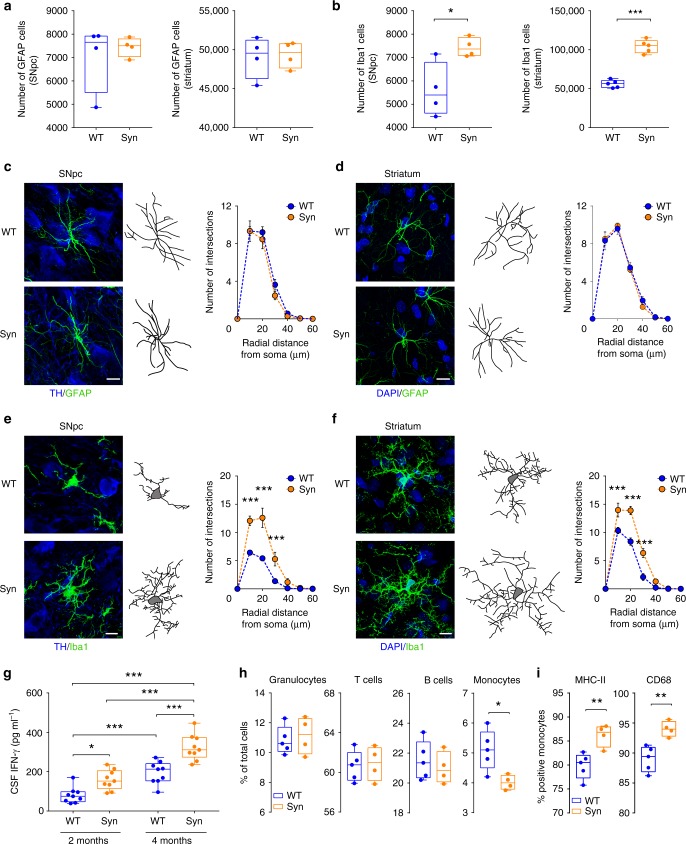
Early neuroinflammatory responses in 4-month-old Syn rats. a GFAP+ cell numbers in SNpc and striatum (SNpc: 4 rats each, Mann-Whitney test P = 0.886; striatum: 4 rats each, Welch’s t-test P = 0.837). b Iba1+ cell numbers in SNpc and striatum (SNpc: 4 rats each, Welch’s t-test *P = 0.044; striatum: 5 rats each, ***P < 1.00 × 10⁻⁴ with Welch’s t-test). c, d TH/GFAP staining in SNpc (c) and DAPI/GFAP staining in striatum (d) of 4-month-old rats (scale: 10 µm) and representative images of 3D-reconstructed astrocytes. The plots show number of intersections (±s.e.m.) in rats (c: 4 rats each; two-way repeated-measures ANOVA: genotype × radial distance from soma, F6,36 = 0.583, P = 0.742; genotype, F1,6 = 0.621, P = 0.461; distance, F6,36 = 194.8, P < 1.00 × 10⁻⁴; WT vs Syn for 0–60 µm: P > 0.05 with Bonferroni’s; d 4 rats each; two-way repeated-measures ANOVA: genotype×distance, F6,36 = 0.368, P = 0.895; genotype, F1,6 = 0.039, P = 0.851; distance, F6,36 = 253, P < 1.00 × 10⁻⁴; WT vs Syn for 0–60 µm: P > 0.05 with Bonferroni’s). See also Supplementary Fig. 3. e, f TH/Iba1 staining in SNpc (e) and DAPI/Iba1 staining in the striatum (f) of 4-month-old rats (scale: 10 µm) and 3D-reconstructed microglia. The plots show number of intersections (±s.e.m.) (e: 4 rats each; two-way repeated-measures ANOVA: genotype×distance, F6,36 = 16.58, P < 1.00 × 10⁻⁴; genotype, F1,6 = 17.05, P = 0.006; distance, F6,36 = 132.2, P < 1 × 10⁻⁴; 10 μm ***P < 1 × 10⁻⁴, 20 μm ***P < 1 × 10⁻⁴, 30 μm ***P < 8 × 10⁻⁴, with Bonferroni’s; f 4 rats each; two-way repeated-measures ANOVA: genotype×distance, F6,36 = 11.99, P < 1 × 10⁻⁴; genotype, F1,6 = 24.0, P = 0.003; distance, F6,36 = 257.9, P < 1 × 10⁻⁴; 10 μm ***P = 1 × 10⁻⁴, 20 μm ***P < 1 × 10⁻⁴, 30 μm ***P < 1 × 10⁻⁴, with Bonferroni’s). See also Supplementary Fig. 4. g CSF IFN-γ levels in WT and Syn rats at the indicated ages (9 WT and 9 Syn rats per age; two-way ANOVA: genotype × age, F1,32 = 1.95, P = 0.172; genotype, F1,32 = 33.44, P < 1.00 × 10⁻⁴; age, F1,32 = 60.84, P < 1.00 × 10⁻⁴; WT 2-Syn 2 *P = 0.024, WT 2-WT 4 ***P = 5.00 × 10⁻⁴, WT 2-Syn 4 ***P < 1.00 × 10⁻⁴, Syn 2-Syn 4 ***P < 1.00 × 10⁻⁴, WT 4-Syn 4 ***P < 1.00 × 10⁻⁴ with Bonferroni’s). h Percentage of peripheral blood cells gated on live leukocytes or on CD11b+ monocytes (5 WT, 4 Syn; granulocytes: P = 0.696; T-lymphocytes: P = 0.827; B-lymphocytes: P = 0.544; monocytes: *P = 0.019, with Welch’s t-test). i Percentage of peripheral monocytes expressing MHC-II and CD68 (5 WT, 4 Syn; MHC-II: **P = 0.007; CD68: **P = 0.004, with Welch’s t-test). Source data are provided as a Source Data file

