Fig. 5.
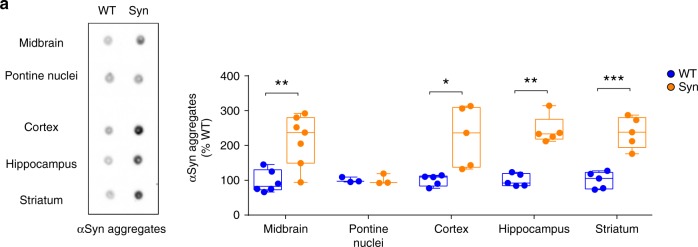
Region-specific aggregation of pathological α-syn in Syn rats. a Representative dot blot of midbrain, pontine nuclei, cortex, hippocampus and striatum homogenates from 4-month-old WT and Syn rats, immunostained with the conformation-specific α-syn antibody [MJFR-14-6-4-2], and densitometric quantification. The plot shows the levels of α-syn aggregates (expressed as % of WT). (Midbrain: 6 WT rats and 7 Syn rats, Welch’s t-test **P = 0.004; Pontine nuclei: 3 rats per genotype, Welch’s t-test P = 0.926; Cortex: 5 rats per genotype, Welch’s t-test *P = 0.030; Hippocampus: 5 rats per genotype, Mann–Whitney test **P = 0.008; Striatum: 5 rats per genotype, Welch’s t-test ***P = 0.001). The full blot and raw data are provided as a Source Data file

