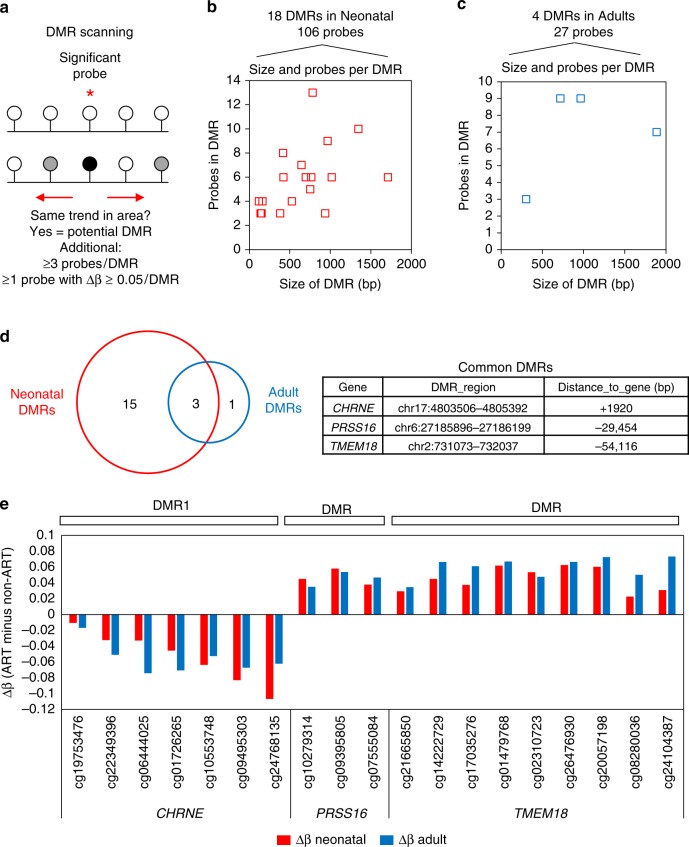
Fig. 2.
Identification of ART-associated differentially methylated regions in neonatal and adult blood. a. Overview of the strategy used to identify DMRs. For each probe with an adjusted p-value <0.05 (Bayesian levene’s test) identified during linear regression analysis, DMRcate was used to scan the surrounding region for probes that show the same general DNA methylation change. Once regions were identified by DMRcate, the following cut-offs were used: at least 3 probes in the region, at least 1 of which has a Δβ ≥ 5%. b. Scatterplot of DMR size and number of probes within a DMR in neonatal blood. A total of 106 probes within 18 DMRs were identified, with the size ranging from 100 to 1700 bp and number of probes per DMR ranging from 3 to 13. c Scatterplot of DMR size and number of probes within a DMR in adult blood. A total of 27 probes within 4 DMRs were identified, with the size ranging from 300 to 1900 bp and number of probes per DMR ranging from 3 to 9. d Venn diagram showing that three DMRs which overlap between neonatal and adult blood. The name of nearest gene, location of DMR, and distance to gene TSS is shown for the common DMRs. e Column graph showing Δβ between mean ART and mean control for individual probes within the three common DMRs for neonatal (red) and adult (blue) blood. Probe ID and gene name are shown on the x axis

