Fig. 5.
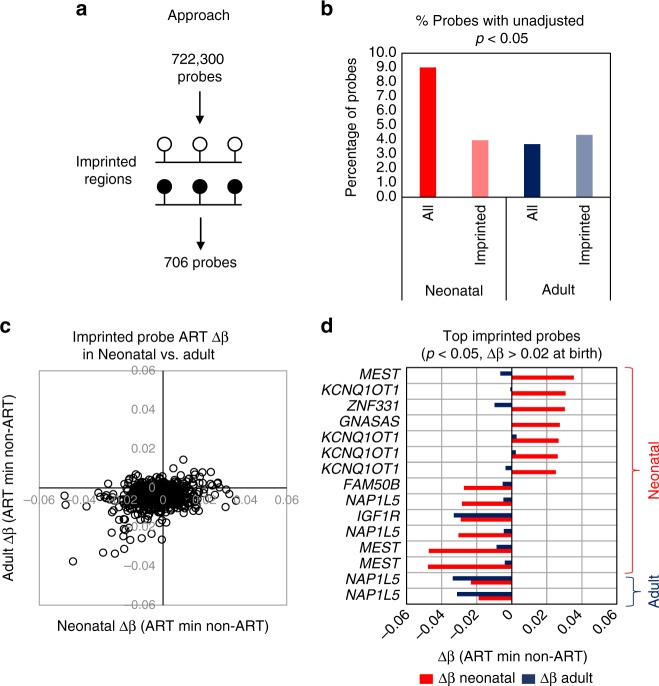
No evidence for ART-associated DNA methylation change at imprinted genes. a Strategy for analysis of DNA methylation at imprinted gene regions. A total of 706 probes mapped within 50 imprinted regions. b Column plot showing the percentage of all probes and probes at imprinted regions showing a difference between ART and non-ART groups at an unadjusted p-value <0.05 (Bayesian levene’s test). This analysis shows that imprinted regions are less likely to have an ART-associated DNA methylation change than the average gene region. c Correlation plot of mean DNA methylation change between ART and non-ART in neonatal (x-axis) and adult (y-axis) blood at all imprinted probes. This shows that no probes show a Δβ ≥ 4% in adults, while only two probes meets this criteria in neonatal blood. d Bar plot of neonatal (red) and adult (blue) blood Δβ values for top ranked imprinted probes based on methylation change in neonatal or adult blood, with name of nearest gene

