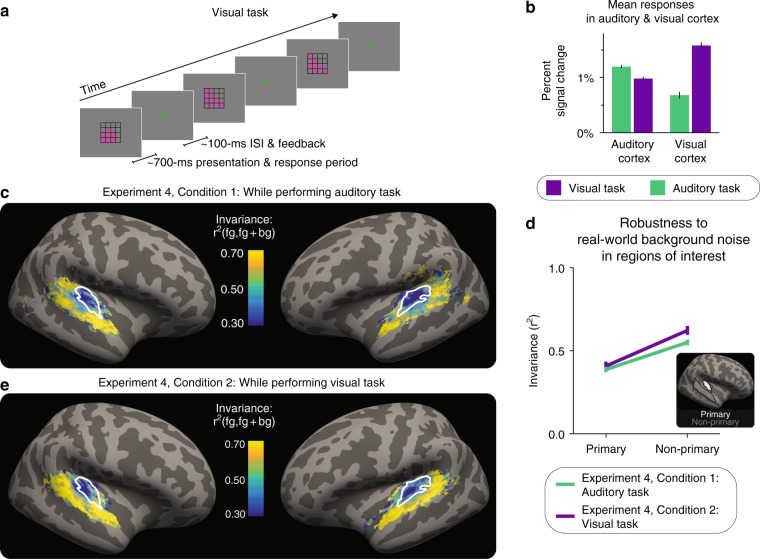
Fig. 4.
Increased invariance in non-primary areas is robust to inattention. a Schematic of visual task. b Mean responses in auditory and visual cortex during each task. Error bars are within-participant SEM. c The results of Experiment 4, Condition 1 (n = 21): map of invariance metric for real-world background noises during the auditory task, averaged across participants and hemispheres. White outlines: primary-like areas, defined anatomically. d Median of invariance metric in a primary and non-primary region of interest (ROI), averaged across participants and hemispheres. Error bars are within-participants SEM. Inset: outlines of anatomical ROIs. e The results of Experiment 4, Condition 2 (n = 21): map of invariance metric for real-world background noises during the visual task, averaged across participants. Plotting conventions, including colorscale, are identical to (c)

