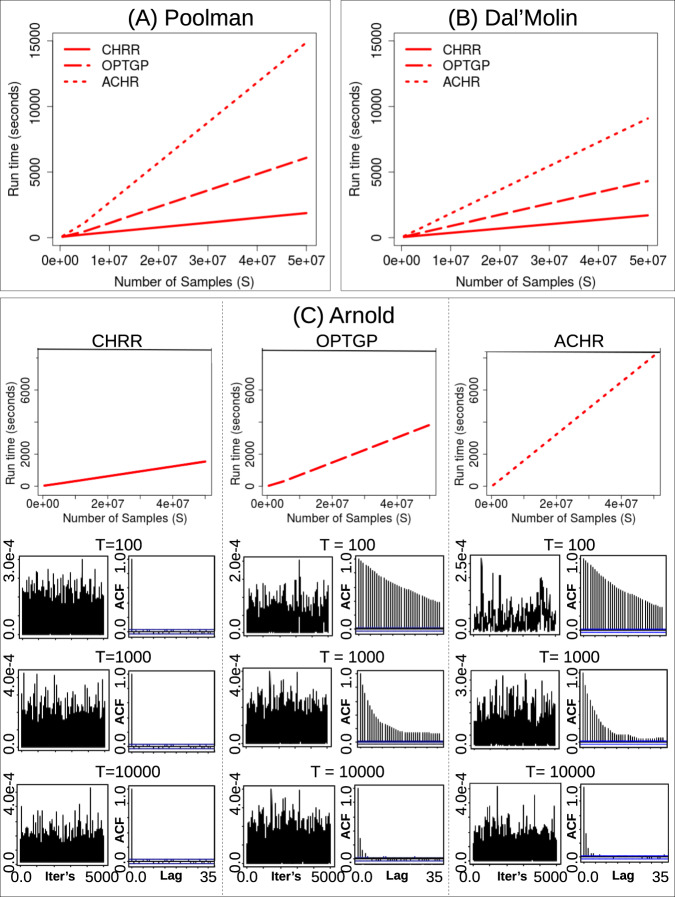
Fig. 2.
Run-times for each of the algorithms on their respective platforms (CHRR: MATLAB; ACHR: Python; OPTGP: Python) when sampling flux solution for the Poolman a, Dal’Molin b, and Arnold model c. Trace and autocorrelation (ACF) plots (showing sampling chains and sample dependence, respectively) for chains of length 5000 with thinnings of T = 100, 1000, and 10,000 of the biomass reaction, as obtained when using each of the algorithms on the Arnold model

