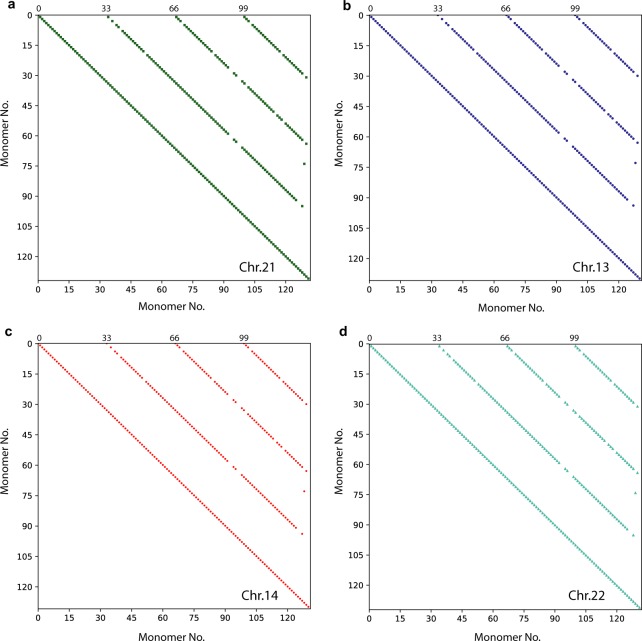
Figure 4.
Dot-matrix plots of 33mer HORs in four acrocentric chromosomes. (a) chromosome 21; (b) chromosome 13; (c) chromosome 14; (d) chromosome 22. Dot-matrix analyses determined the presence or absence of HOR structure using a window size of monomer length and mismatch limits ranging at ~7%. Monomers are labeled in order of appearance, displayed in matrix along the upper horizontal axis (from left to right) and along the left vertical axis (from up to down): at both axes label 1 corresponds to the first monomer in alpha satellite ensemble, label 2 to the second monomer, etc. In this way, the alpha satellite ensemble is compared with itself, giving pairwise comparisons of divergence between constituting alpha satellite monomers. Each cell in dot-matrix which represents divergence between monomers located at identical positions in different HOR copies (e.g. the second monomer in the third HOR copy on the horizontal axis and the second monomer in the fourth HOR copy on the vertical axis, etc.) correspond to relatively small divergence between monomers (here chosen below 7%) and is shown as colored dot. The other cells in dot-matrix correspond to higher divergence (above 7%) are blank. In this way, for each HOR array the dot-matrix diagram is obtained as a set of equidistant diagonal lines at spacing equal to the number of monomers in HOR unit (n = 33), parallel to the self-diagonal.

