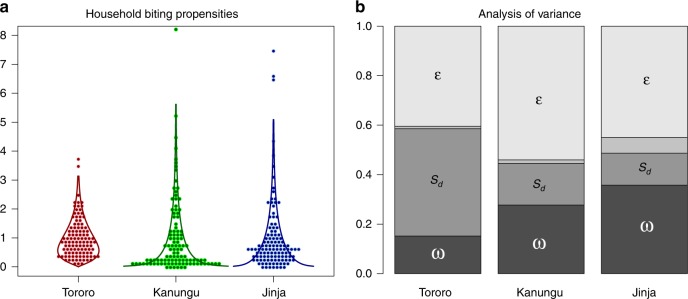
Fig. 2.
Biting weights and results of the variance components analysis. a Distribution of biting weights (i.e., the points are the fitted values ωh,n from the fitting procedure) and a Gamma distribution fitted to describe the points using MLE (solid lines, plotted to the 99th quantile) for Jinja, Gamma(1.03, 1.03); Kanungu, Gamma(0.71, 0.71); Tororo, Gamma(2.41, 2.41). b Proportion of variance explained by biting weights (ω), seasonality in the HBR (S), the estimated sampling variance (the smallest sliver), and environmental stochasticity and measurement errors (ε)

