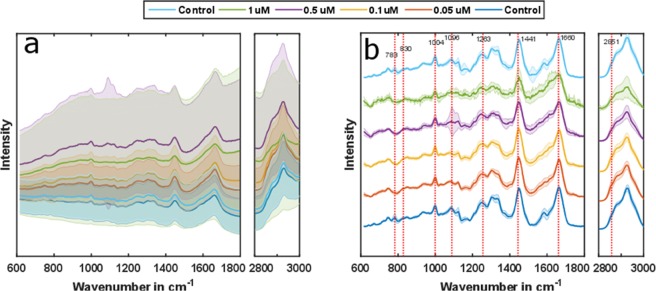
Figure 1.
The mean Raman spectra and corresponding standard deviations of samples for a chosen spectral range are shown before (a) and after the background correction (b). Although there is some spectral information detectable before background correction, more spectral features are evident in the background corrected spectra. Some changes in the spectral bands for different DOX concentrations are visually observed, indicating intracellular macromolecular variations.

