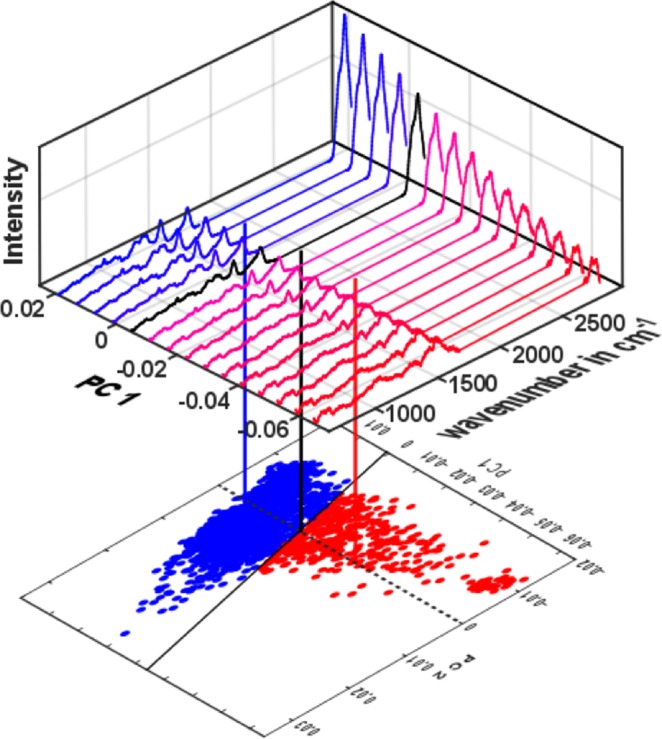
Figure 4.

Color-coding of the score plot is done based on the PCA-SVM model prediction, where the corresponding model regions are separated by the decision boundary (solid black line). The scores along the dashed black line, parallel to the PC1 axis in the score plot are used to compute the corresponding spectra. The transition along this dashed line from non-viable to the viable side (from red towards blue region) illustrates the changes in the Raman bands for the two viability states. The black spectrum whose scores lay on the decision boundary represents a threshold. Thus, the cell viability can be related to Raman bands of cellular macromolecules content.
