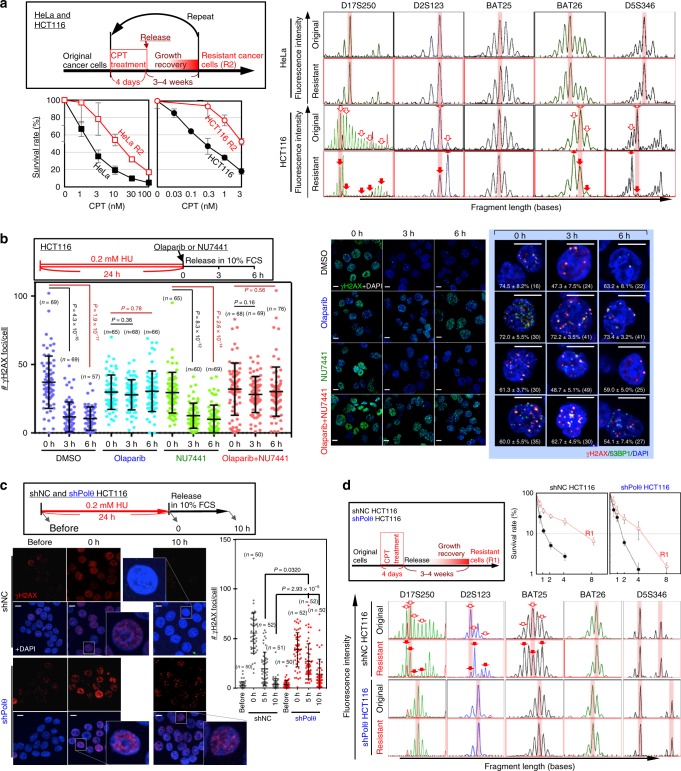
Fig. 6.
PARP mediates MSI induction and CIN suppression. a The HCT116 (MMR-deficient) and HeLa (MMR-proficient) cancer cell lines were treated as shown in the upper box to induce resistance to CPT. The original and resulting (R2) cells were subsequently treated with CPT, and their survival efficiencies and MSI induction at the indicated loci were assessed. Red arrows indicate the shifted fragment peaks, i.e., MSI. Graphs show mean survival rates ± s.d. (n = 3 independent experiments with the same cell line). b HCT116 cells treated with HU were cultivated in the presence and the absence of Olaparib and NU7441. Thereafter, γH2AX foci or γH2AX/53BP1 foci were monitored by immunofluorescence (n numbers are indicated in graph). Percentages of γH2AX foci merged with 53BP1 foci (means ± s.e.) are indicated in each image (n numbers are in images). Bars show means ± s.d. Scale bars, 10 μm. Two-tailed Welch’s t-test was used for statistical analysis. c HCT116 cells, with or without stable down-regulation of Polθ, were treated with HU (see upper box), and γH2AX accumulation was monitored by immunofluorescence (n numbers are indicated in graph). Bars are shown as mean ± s.d. Scale bars, 10 μm. Two-tailed Welch’s t-test was used for statistical analysis. d HCT116 cells, with or without stable down-regulation of Polθ, were treated as shown in the upper-left box to obtain cells resistant to CPT. The resultant and original cells were treated with CPT, and their survival efficiencies and MSI statuses were assessed. Red arrowheads indicate the shifted fragment peaks, i.e., MSI. Graph shows mean cell numbers ± s.d. (n = 3 independent experiments with three independent clones)

