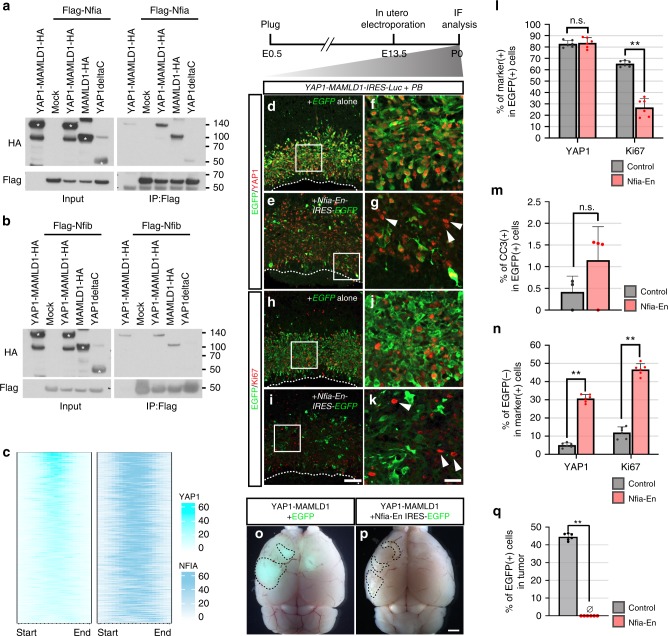
Fig. 7.
Roles of Nuclear factor I proteins in YAP1-MAMLD1-driven tumorigenesis. a, b Immunoprecipitation assay of Flag-tagged a Nfia and b Nfib and HA-tagged YAP1 fusion-related proteins in HEK293T cells. Asterisks indicate overexpressed proteins according to their predicted molecular weights. c An enriched heatmap of YAP1 and NFIA ChIP-seq signals within the regions of ST-EPN-YAP1 group-specific YAP1 peaks. d–g IHC of P0 brains with anti-GFP (green) and anti-YAP1 (red) antibodies after electroporation of YAP1-MAMLD1-IRES-Luc and either d, f EGFP alone or e, g Nfia-En-IRES-EGFP. Arrowheads in g indicate the cells expressing exogenous YAP1-MAMLD1 but Nfia-En-EGFP. f and g are high magnification views of the area outlined by a rectangle in d and e, respectively. PB Piggybac transposase. h–k IHC of P0 brains with anti-GFP (green) and anti-Ki67 (red) antibodies after electroporation of YAP1-MAMLD1-IRES-Luc and either h, j EGFP alone or I, k Nfia-En-IRES-EGFP. Arrowheads in k indicate abnormally proliferating cells lacking Nfia-En expression. j and k are high magnification views of the area outlined by a rectangle in h and i, respectively. Scale bar in i is 100 μm (for d, e, h, and i) and the scale bar in k is 25 μm (for f, g, j, and k). l The graph represents the percentages of YAP1- and Ki67-positive cells within EGFP-positive cells. Data obtained from three independent brain samples. **p < 0.0001, n.s., not significant. The error bars indicate mean ± S.D. (n = 6). m The graph indicates the percentage of YAP1- and cleaved caspase 3-positive cells within EGFP-positive cells. p = 0.554. The error bars indicate mean ± S.D. (n = 4). n The graph indicates the percentage of YAP1- and Ki67-positive cells lacking EGFP expression. **p < 0.0001. The error bars indicate mean ± S.D. (n = 6). o, p Dorsal views of the brains bearing tumors from the mice electroporated with YAP1-MAMLD1-Luc with EGFP (o) and Nfia-Rn-IRES-EGFP (p). EGFP signals are detected only in (o). Scale bar, 1 mm. q The graph shows the percentage of EGFP-positive cells in the tumor tissues. **p < 0.0001. The error bars indicate mean ± S.D. (n = 6). Significant differences for l–n, q were assessed by t-test

