Fig. 3.
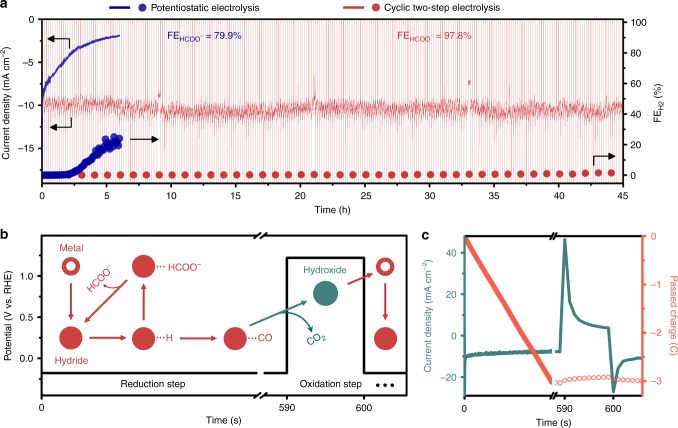
HCOO− production performance of cyclic two-step electrolysis. a Comparison between cyclic two-step electrolysis and potentiostatic electrolysis in terms of the current density and product selectivity. The blue and red lines represent the current density vs. time curves measured via potentiostatic electrolysis and cyclic two-step electrolysis, respectively. The blue and red circles represent H2 production selectivity. Both experiments were conducted in a flow cell system where CO2-saturated bicarbonate solution was continuously refreshed using a peristaltic pump. b Potential program and reaction scheme of the cyclic two-step electrolysis. In the reduction step, −0.18 V vs. RHE was applied for 590 s, whereas 1.22 V vs. RHE was applied for 10 s in the oxidation step. c Current density vs. time curves and net passed charges during cyclic two-step electrolysis. The charge used in the oxidation step accounts for 3.7% of the charge passed in the reduction step

