Figure 1.
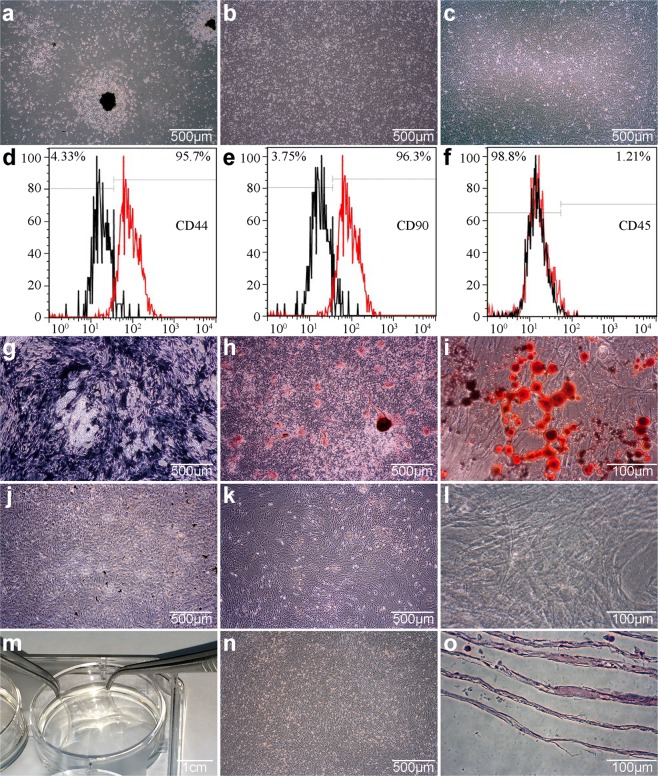
Rat BMSC cultures, identification and cell sheets fabrication. (a) Cell morphology after 1 day at passage 0. Scale bar = 500 µm. (b) Cell morphology after 7 days at passage 0. Scale bar = 500 µm. (c) Cell morphology at passage 3. Scale bar = 500 µm. (d–f) Assay of cell surface antigens in BMSCs. (g) Osteogenic induction of cells after 21 days, ALP staining. Scale bar = 500 µm. (h) Osteogenic induction of cells after 21 days, Alizarin Red S staining. Scale bar = 500 µm. (i) Adipogenic induction of cells after 14 day, Oil Red O staining. Scale bar = 100 µm. (j) Uninduced cells after 21 day, ALP staining. Scale bar = 500 µm. (k) Uninduced cells after 21 days, Alizarin Red S staining. Scale bar = 500 µm. (l) Uninduced cells after 14 days, Oil Red O staining. Scale bar = 100 µm. (m) Macroscopic images of BMSC sheets. Scale bar = 1 cm. (n) Cell sheets morphology after 14 days of induction. Scale bar = 500 µm. (o) H&E staining of BMSC sheets. Scale bar = 100 µm.

