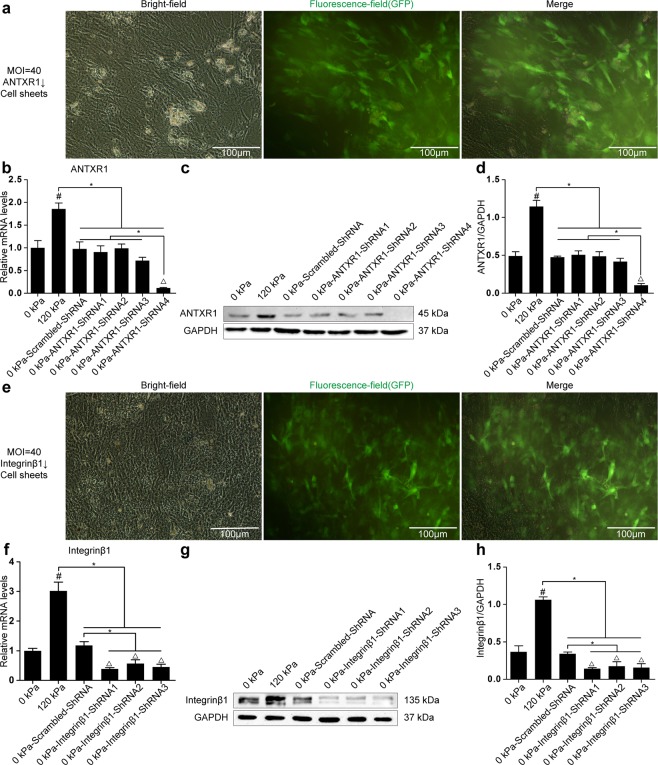
Figure 3.
Establishment of ANTXR1-downregulated or integrinβ1-downregulated BMSC sheets. (a) Fluorescent microscopy images of BMSC sheets transfected with ANTXR1-shRNA at MOI = 40. Scale bar = 500 µm. (b) RT-PCR was performed to determine the mRNA expression levels of ANTXR1. (c,d) Western blotting was performed to determine the protein expression levels of ANTXR1, followed by the quantitative analysis of the western blotting bands by ImageJ software. (e) Fluorescent microscopy images of BMSC sheets transfected with integrinβ1-shRNA at MOI = 40. Scale bar = 500 µm. (f) RT-PCR was performed to determine the mRNA expression levels of integrinβ1. (g–h) Western blotting was performed to determine protein expression levels of integrinβ1, followed by the quantitative analysis of the western blotting bands by ImageJ software.

