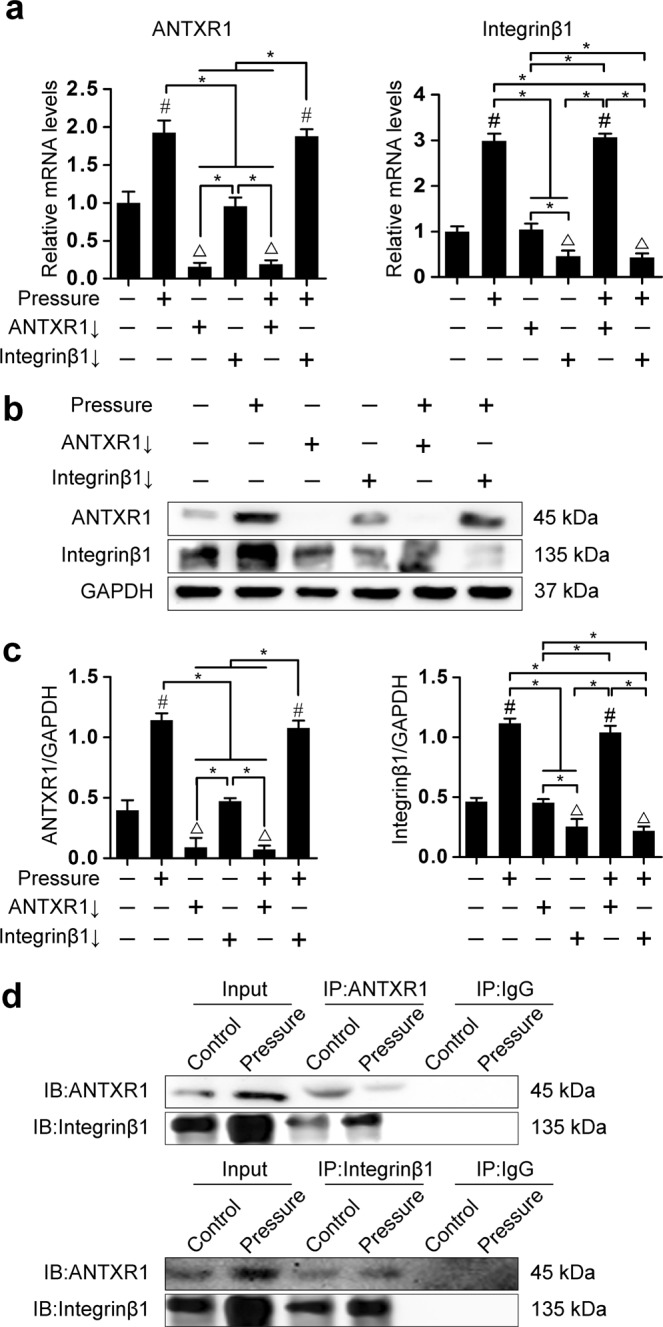
Figure 5.

Association between ANTXR1 and integrinβ1. (a) RT-PCR was performed to determine the mRNA expression levels of ANTXR1 and integrinβ1. (b) Western blotting was performed to determine the protein expression levels of ANTXR1 and integrinβ1. (c) Quantitative analysis of the western blotting bands by ImageJ software. (d) Interactions between ANTXR1 and integrinβ1 were demonstrated by Co-IP assays. Western blots of the inputs and immunoprecipitates were analyzed using the indicated antibodies. Four independent assays were performed for each group. Data presented as the mean ± SD. #P < 0.05 represents a significant increase compared with the control group. *P < 0.05 represents a significant difference compared with the indicated groups. △P < 0.05 represents a significant decrease compared with the control group.
