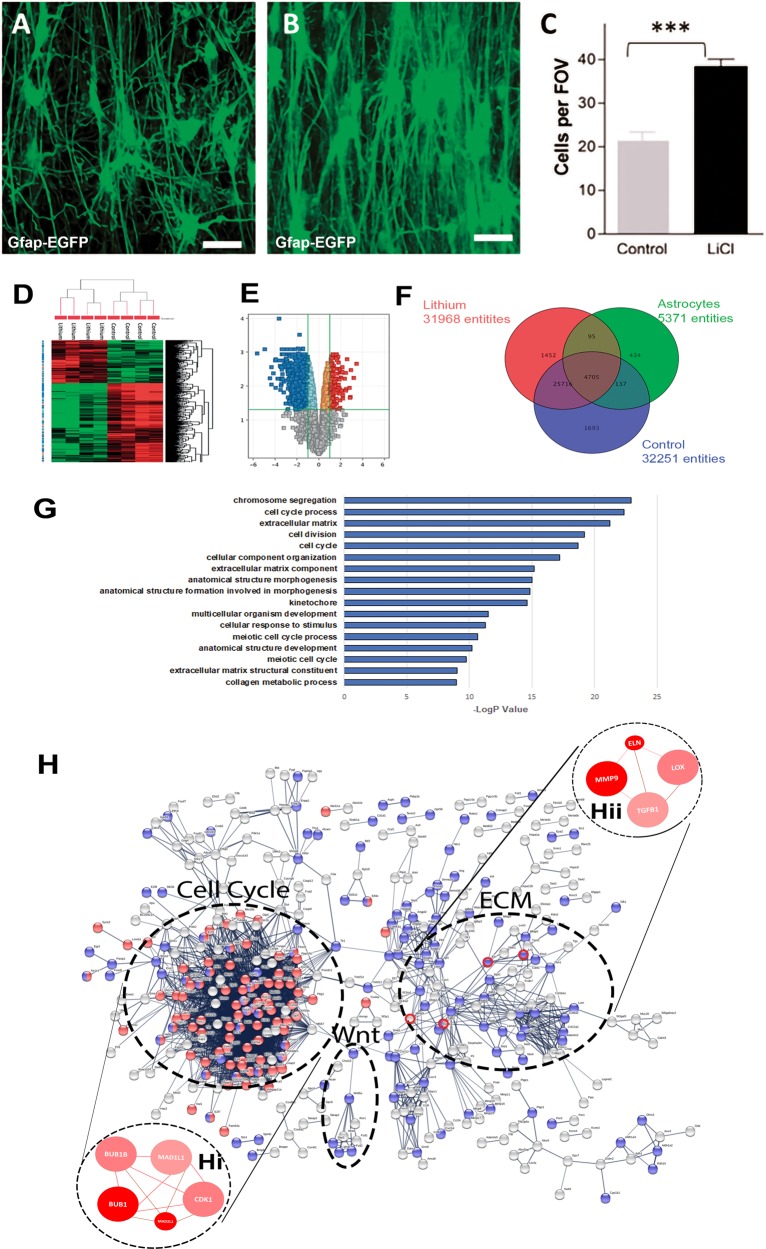
Fig. 1. Identification of regulatory mechanisms of lithium in controlling astrocyte morphogenesis and proliferation.
The effects of lithium on astrocytes were examined ex vivo in organotypic cultures of optic nerves from 5- to 6-week-old transgenic mice in which the astroglial gene glial fibrillary acidic protein (GFAP) drives the expression of enhanced green fluorescent protein (EGFP), to identify astrocytes. Confocal images of whole mounts of optic nerves maintained in culture for 3 days in control medium (a), or medium containing lithium (b). Compared to controls (a), lithium induced the formation of highly polarised astrocytes that formed a dense palisade traversing the nerve (b), Scale bars = 50 μm. c Graph of cell counts taken from a constant field of view (FOV, 200 µm x 200 µm) illustrating lithium doubled the number of astrocytes in the optic nerve; data are mean ± SEM (n ≥ 6 nerves in each treatment group), **p < 0.01, ***p < 0.001, Student’s t test. Microarray analysis using Affymetrix GeneChip Mouse Genome 430 2.0 was performed on optic nerves from 5- to 6-week-old C57/BL10 mice maintained ex vivo in organotypic cultures for 3 days in control medium or medium containing lithium. d Unsupervised hierarchical clustering of gene expression changes induced by lithium compared to controls, where red and green indicate up- and downregulated genes, respectively. e Volcano plot analysis was used to identify statistically represented genes with a false discovery rate (FDR) < 0.05 and an absolute fold change (FC) > 2.0. f Lithium responsive astroglial genes (4705 entities) were determined by interrogating the optic nerve gene datasets against the gene sets for astrocytes31–33. g GO analysis of astroglial genes altered by lithium identified cell cycle and extracellular matrix (ECM) as the major biological processes regulated by lithium. h Neighbourhood-based entity set analysis (NEST) of cell cycle genes (hi) and ECM genes (hii) identified by String analysis of predicted protein–protein interactions (circled in red). NEST analysis of ECM genes (hi, hii) identified lysyl oxidase (LOX), Elastin (Eln), Metalloprotienase 9 (Mmp9) and transforming growth factor beta 1 (Tgfb1) as major astroglial targets of lithium (dark and light red nodes have significant enrichment levels (p < 0.0001), whilst thickness of connection lines represent the number of shared genes across nodes, and colour shade represents the number of shared input genes)

