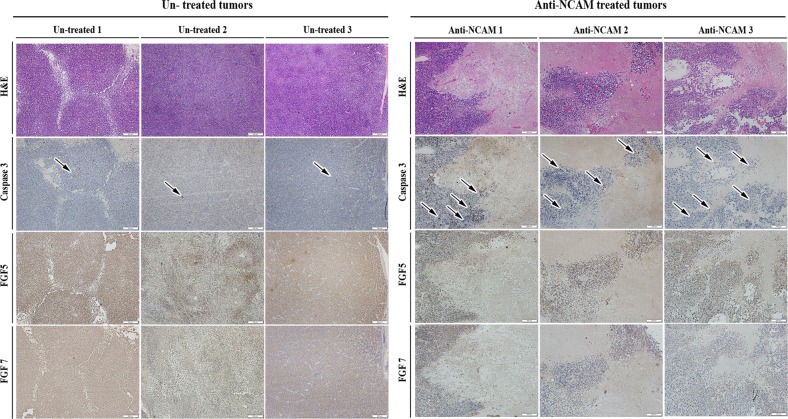
Fig. 5. IHC characterization of un-treated PPB tumor samples (left panel) vs. PPB tumor samples treated with anti-NCAM antibody (right panel).
PPB H&E tissue staining demonstrated vast areas of necrosis following treatment (top panel); Immunohistochemical staining of cleaved caspase-3 demonstrating increased staining in treated tumor samples (black arrows indicate high caspase-3 expressing cells), (middle panel); FGF5 and FGF7 IHC staining showed downregulation of these key FGF pathway molecules in anti-NCAM treated tumor samples (bottom 2 panels); Scale bar; 200 μm

