Figure 2.
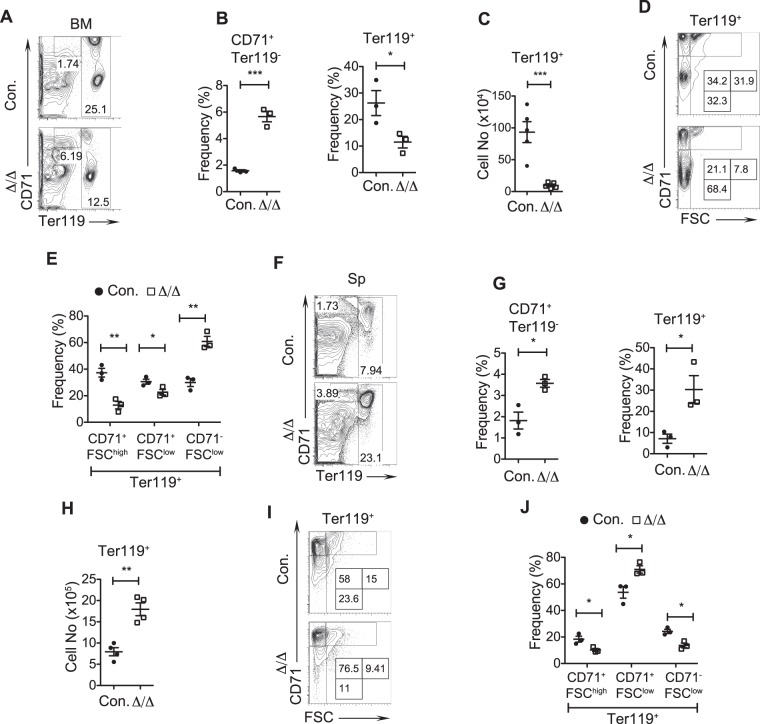
Erythroid differentiation is perturbed in A20 deficient mice. (A–C) FACS plots (A), frequencies (B) and absolute numbers (C) of erythroid cells from the bone marrow (BM) of 14 days old A20Hem-KO and control mice (n = 3–5). (D,E) FACS plots (D) and frequencies (E) exhibiting differentiation of erythroid cells (EryA to EryC) in the BM of 14 days old A20Hem-KO and control mice (n = 3). (F–H) FACS plots (F), frequencies (G) and absolute numbers (H) of erythroid cells from the spleen of 14 days old A20Hem-KO and control mice (n = 3–4). (I,J) FACS plots (I) and frequencies (J) exhibiting differentiation of erythroid cells (EryA to EryC) in the spleen (Sp) of 14 days old A20Hem-KO and control mice (n = 3). All data represent mean ± SEM. Two-tailed student’s t tests were used to assess statistical significance (*P < 0.05, **P < 0.01, ***P < 0.001).

