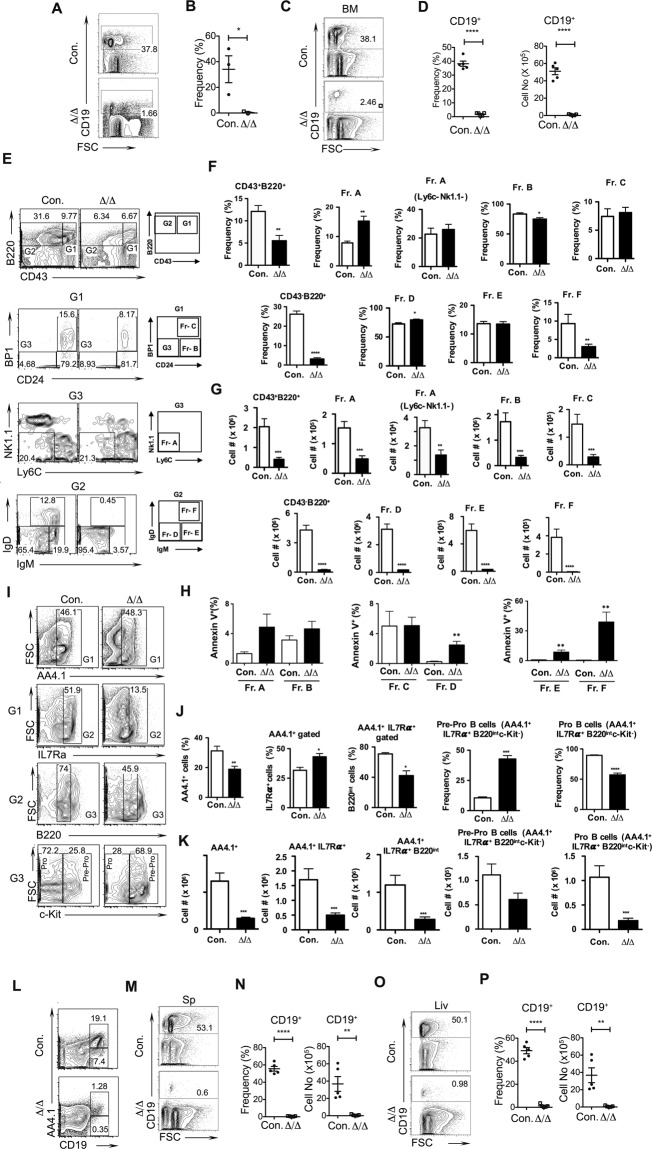
Figure 3.
Loss of A20 causes impaired B cell differentiation. (A,B) FACS plots (A) and frequencies (B) of B cells from the peripheral blood of 14 days old A20Hem-KO and control mice (n = 3). (C,D) FACS plots (C), frequencies and absolute numbers (D) of B cells from the bone marrow (BM) of 14 days old A20Hem-KO and control mice (n = 5). (E–G) Hardy’s Fraction analysis of B cell development. FACS plots (E), frequencies (F) and absolute numbers (G) of B cell subsets from the BM of 14 days old A20Hem-KO (n = 10) and control (n = 5) mice. (H) Frequencies of Annexin V+ cells in Hardy’s Fraction subsets of BM from 14 days old A20Hem-KO (n = 4–8) and control (n = 5–7) mice. (I–K) B cell progenitor analysis. FACS plots (I), frequencies (J) and absolute numbers (K) of B cell subsets from the BM of 14 days old A20Hem-KO (n = 10) and control (n = 5) mice. (L) FACS plots of B cell subsets from the BM of 14 days old A20Hem-KO (n = 15) and control (n = 5) mice. (M,N) FACS plots (M), frequencies and absolute numbers (N) of B cells from the spleen (Sp) of 14 days old A20Hem-KO and control mice (n = 5). (O,P) FACS plots (O), frequencies and absolute numbers (P) of B cells from the liver (Liv) of 14 days old A20Hem-KO and control mice (n = 5). All data represent mean ± SEM. Two-tailed student’s t tests were used to assess statistical significance (*P < 0.05, **P < 0.01, ***P < 0.001).

