Figure 7.

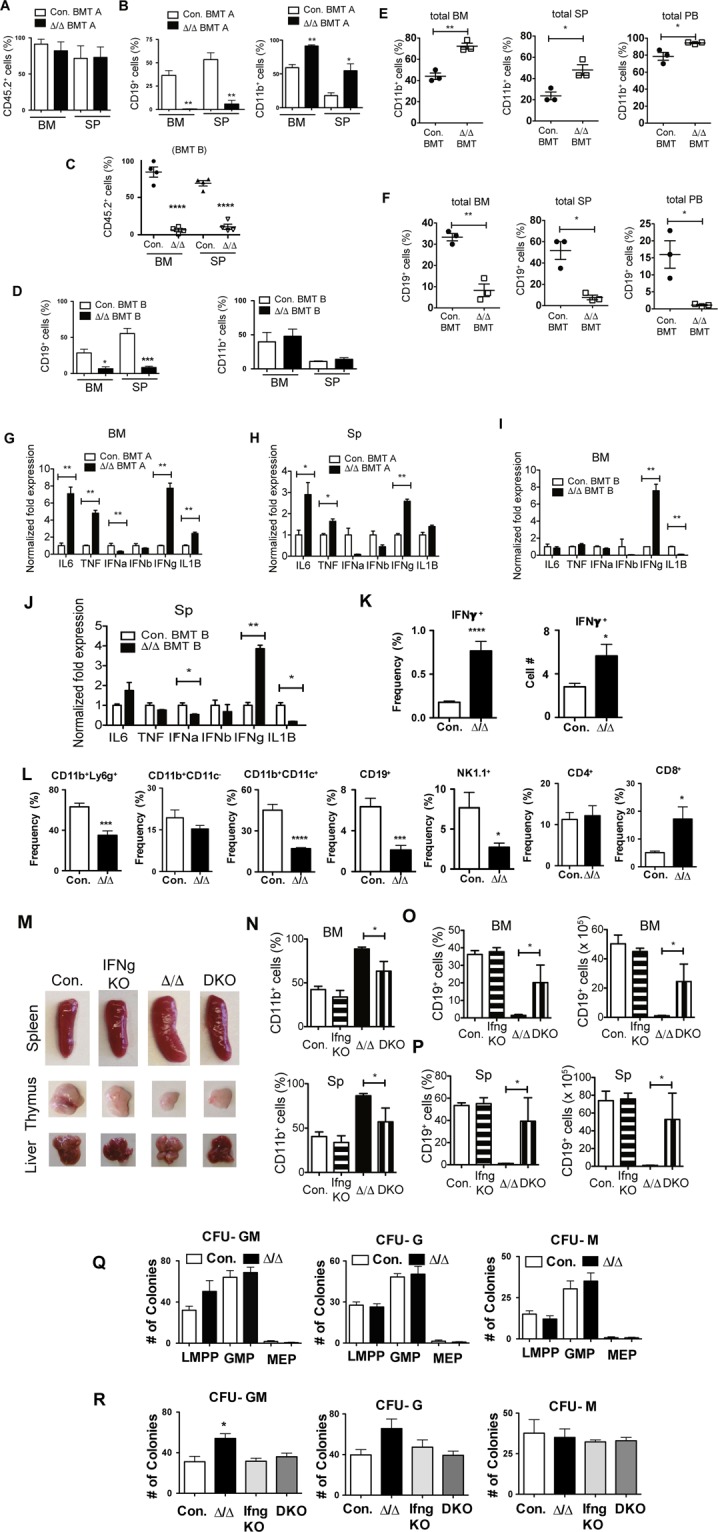
Loss of A20 causes lymphopenia via IFNγ signals. (A,B) Frequencies of donor (CD45.2+) derived hematopoiesis (A), and B cells & myeloid cells (B) in the bone marrow (BM) and spleen (SP) of congenic (CD45.1+) recipient mice (n = 3) that exhibit higher levels (>60%) of donor derived hematopoiesis (BMT-A). (C,D) Frequencies of donor (CD45.2+) derived hematopoiesis (C), and B cells & myeloid cells (D) in the BM and SP of congenic (CD45.1+) recipient mice (n = 4) that exhibit lower levels (<10%) of donor derived hematopoiesis (BMT-B). (E,F) Frequencies of myeloid cells (E) and B cells (F) in total BM (left panels), total spleen (middle panels) and total peripheral blood (right panels) from the recipients with mixed BM chimera containing Control:WT and A20Hem-KO:WT cells (n = 3). (G–J) Real time PCR data for cytokines of total cells from the BM (G,I) and spleen (H,J) of the mice with higher (G,H) and lower (I,J) donor-derived chimerism at 3 weeks after transplantation of either A20Hem-KO or control mice. (K) Frequencies and absolute numbers of IFNγ+ splenocytes of A20Hem-KO and control mice (n = 9). (L) Frequencies and absolute numbers of IFNγ+ immune subsets in the spleen of A20Hem-KO and control mice (n = 9). (M) Pictures of Spleen, thymus and liver of control, IFNγ−/− mice, A20Hem-KO mice and DKO mice. (N) Frequencies of myeloid cells from the BM (upper panel) and spleen (lower panel) of control, IFNγ−/− mice, A20Hem-KO mice and DKO mice (n = 3). (O,P) Frequencies (left panels) and absolute numbers (right panels) of B cells from the BM (O) and spleen (P) of control, IFNγ−/− mice, A20Hem-KO mice and DKO mice (n = 3). Data represent two independent experiments. (Q) Colony Forming Unit (CFU) Assays of hematopoietic progenitor subsets from the BM of A20Hem-KO mice and control mice. Data represent two independent experiments. (R) Colony Forming Unit (CFU) Assays of total BM from control, IFNγ−/− mice, A20Hem-KO mice and DKO mice. Data represent two independent experiments. All data represent mean ± SEM. Two-tailed student’s t tests were used to assess statistical significance (*P < 0.05, **P < 0.01, ***P < 0.001).
