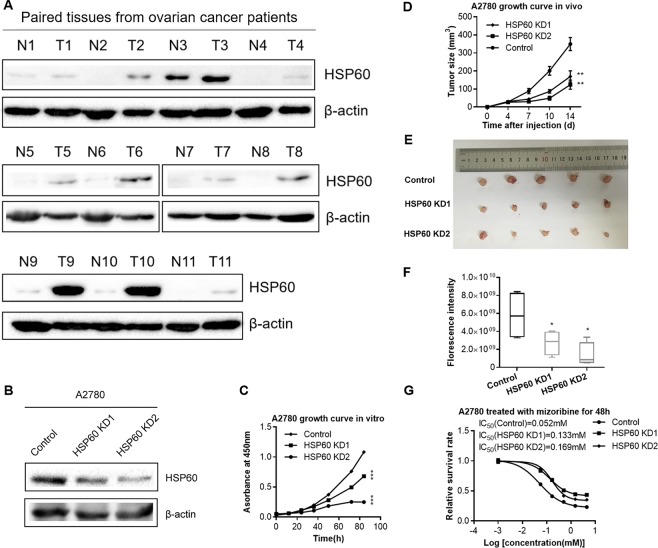
Figure 2.
HSP60 knockdown decreases the growth rate of ovarian cancer cells in vitro and in vivo. (A) Western blotting images of HSP60 expression in 11 paired ovarian tumor tissues (T) and associated normal tissues (N). Juxtaposed images reflected western blotting results of samples gathered at different times. Multiple exposures with different exposure time are presented in Supplementary Fig. S7, full-length/uncropped gels and blots were presented in Supplementary Fig. S8. (B) Western blotting demonstrated that HSP60 was decreased in HSP60-KD A2780 cells compared with control cells. (C) Cell proliferation curve of HSP60-KD A2780 cells as compared to control cells. (D) Growth curves of tumors produced by HSP60-KD A2780 and control cells that were subcutaneously injected into mice. The volumes (mm3) of tumor were examined using digital calipers and estimated with the formula: π/6 × length (mm) × width (mm)2. (E) Images of tumors obtained from mice at 14 days after tumor cell injection. (F) Quantitation of fluorescence intensities. (G) Mizoribine attenuated the growth of HSP60-KD A2780 and control cells. P-values of the growth rate of Mizoribine-treated HSP60-KD1, KD2 A2780 and control cells were 0.0000037 and 0.00048, respectively. Data were calculated by the Student’s t-test. *p < 0.05, **p < 0.01, and ***p < 0.001. *p < 0.05 was considered as statistically significant. Error bars represent ± SEM. The bands of β-actin were from different part of the same gel with the corresponding bands of HSP60.

