Fig. 5.
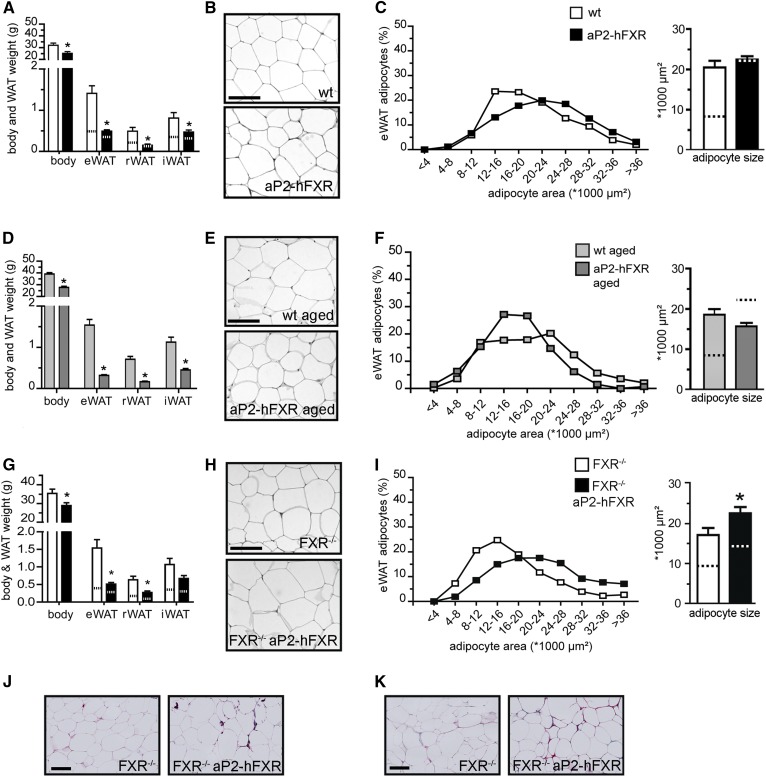
HFD prevents further growth of hypertrophic adipocytes in aP2-hFXR mice and fat depot expansion is limited. A: Body and WAT weight of wild-type (wt) and aP2-hFXR mice after 6 weeks of HFD. The dotted lines indicate WAT weights of chow-fed mice (presented in Fig. 1). eWAT morphology (B) and distribution and average of adipocyte size (C) after 6 weeks of HFD. D: Body and WAT weight of 1-year-old chow-fed wild-type and aP2-hFXR mice. eWAT morphology (E) and distribution and average adipocyte size (F) of 1-year-old wild-type and aP2-hFXR mice. G: Body and WAT weight of FXR−/− aP2-hFXR mice after 6 weeks of HFD. Dotted lines indicate weights of chow-fed control animals (depicted in Fig. 2). eWAT morphology (H) and distribution of adipocyte size and average adipocyte size (I) of FXR−/− aP2-hFXR mice after 6 weeks of HFD. Sirius red fibrosis staining of iWAT (J) and eWAT (K) after 13 weeks of HFD (n = 6–9 per group; data are represented as mean ± SEM; *P < 0.05). Scale bar represents 100 μm.

