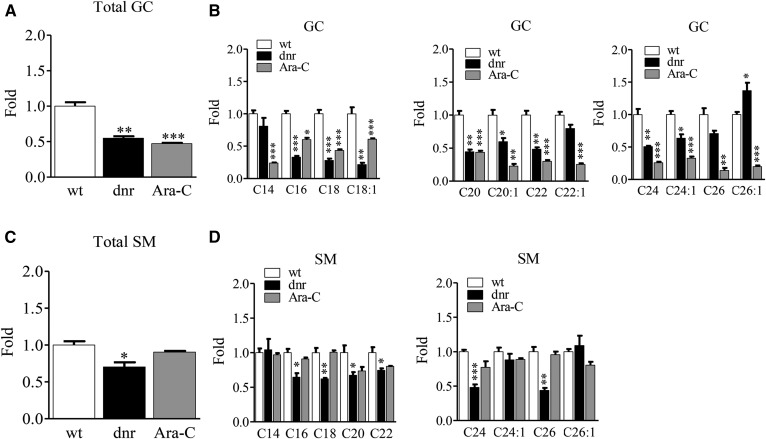
Fig. 6.
Impact of dnr and Ara-C selection pressure in HL-60 cells on levels of higher sphingolipids. A: Total GC levels. B: GC molecular species. C: Total SM levels. D: Levels of SM molecular species. Cell preparations are the same as those in Fig. 5. Data expressed as fold changes compared with wt cells.

