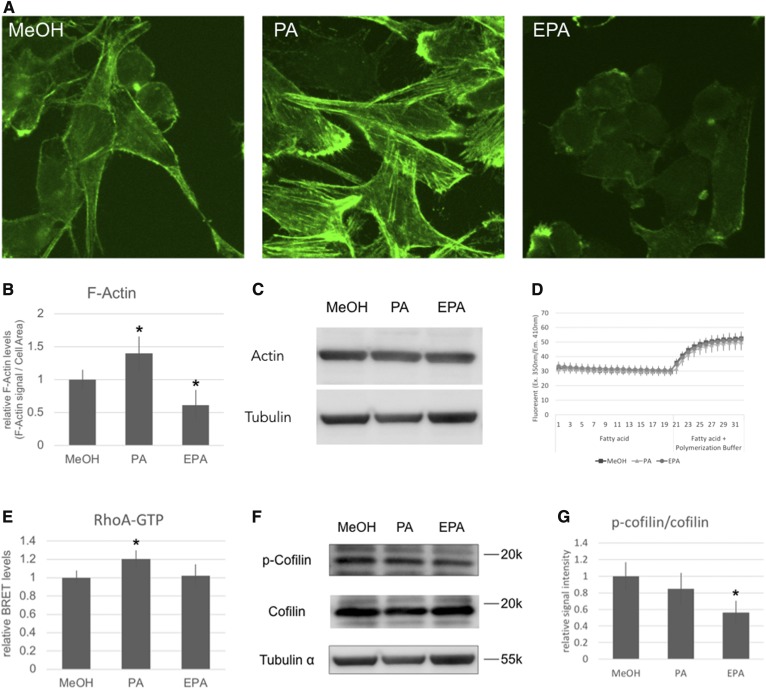
Fig. 3.
Analysis of actin. A: B16F10 cells cultured in the presence of 50 μM of PA or EPA for 24 h were stained by phalloidin. B: Quantitative analysis of the phalloidin fluorescence signal. The fluorescence signals per 100 μm2 of the cell were measured using with ImageJ Fiji software. The values indicate the mean ± SD of four individual fields. C: Western blot analysis of α-actin protein. D: Actin polymerization assay performed in vitro. The values indicate the mean ± SD of eight individual wells. E: BRET assay of RhoA and Rtkn. The values indicate the mean ± SD of eight individual wells. F: Western blot analysis of phosphorylated cofilin and total cofilin. G: The quantitative analysis of the ratio of phosphorylated cofilin to total cofilin. The values indicate the mean ± SD of four individual samples. *Significant difference of P < 0.05.

