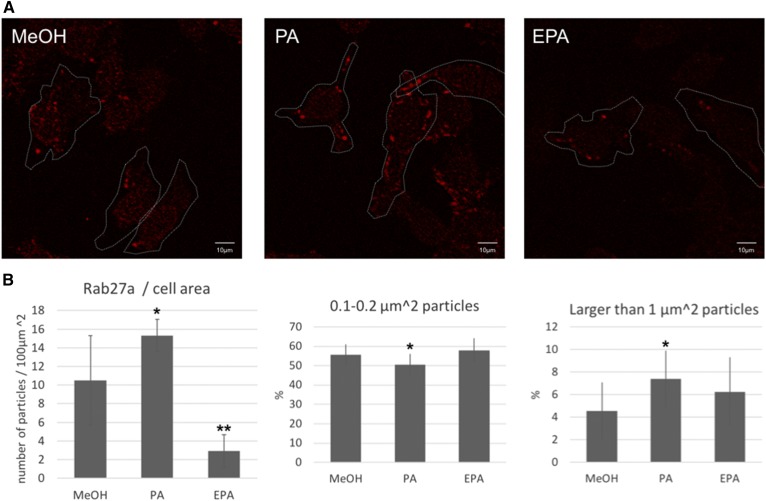
Fig. 4.
Immunofluorescent staining of Rab27a. A: B16F10 cells cultured in the presence of 50 μM of PA or EPA for 24 h were stained with a Rab27a-specific antibody. The white broken line indicates the outline of the cell drawn in bright field. B: Quantitative analysis of Rab27a signals. The number of particles and the proportion of small or large sized particles were measured for four individual fields. The values indicate the mean ± SD. Significant difference: *P < 0.05; **P < 0.01.

