Fig. 5.
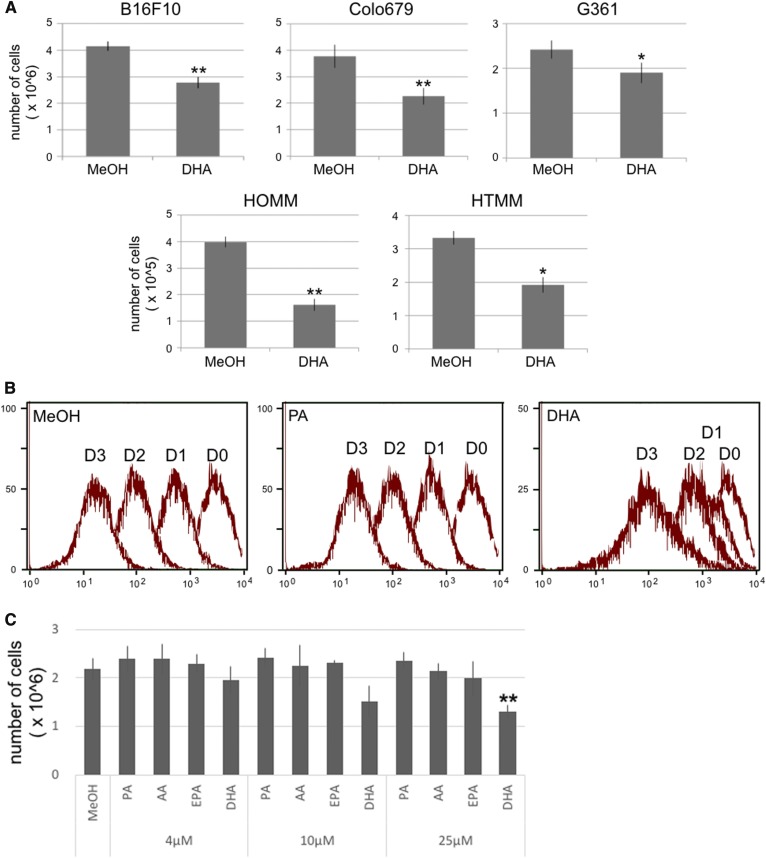
The proliferation and cell cycle analysis of melanoma. A: The mouse and human melanoma cell lines were cultured in the presence of 25 μM of DHA for 48 h. The values indicate the mean ± SD of three individual samples. B: B16F10 cells were stained with CytoTrack green for 15 min, and then the fluorescence signals in the cells were measured by flow cytometry every 24 h for 3 days. D0, D1, D2, and D3 indicate day 0, day 1, day 2, and day 3, respectively. C: Effect of fatty acids on the proliferation of B16F10 cells. Significant difference: *P < 0.05; **P < 0.01.

