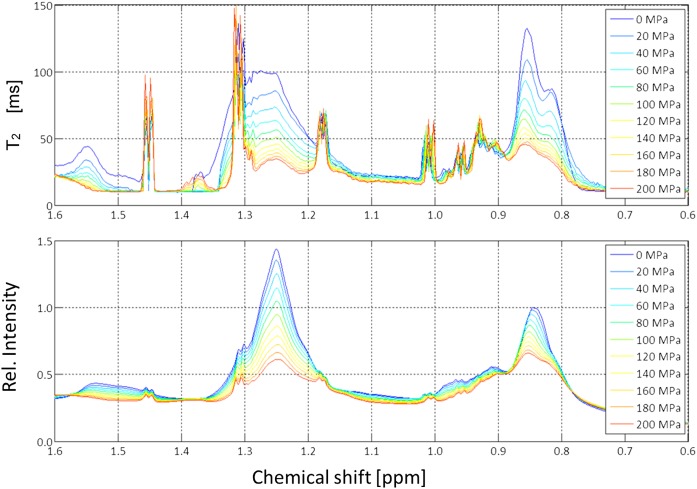
Fig. 10.
Pressure dependence of the transverse relaxation times of lipid signals in human blood serum. Upfield part of the 800 MHz spectrum of human blood serum recorded at 313 K. Same sample as shown in Fig. 9. Bottom: The 1D NMR spectra at different pressures. Top: T2 values measured with a CPMG-pulse sequence at various pressures. The T2-values were calculated for small slots of 0.003 ppm and depicted as a function of chemical shifts. Rel., relative.

