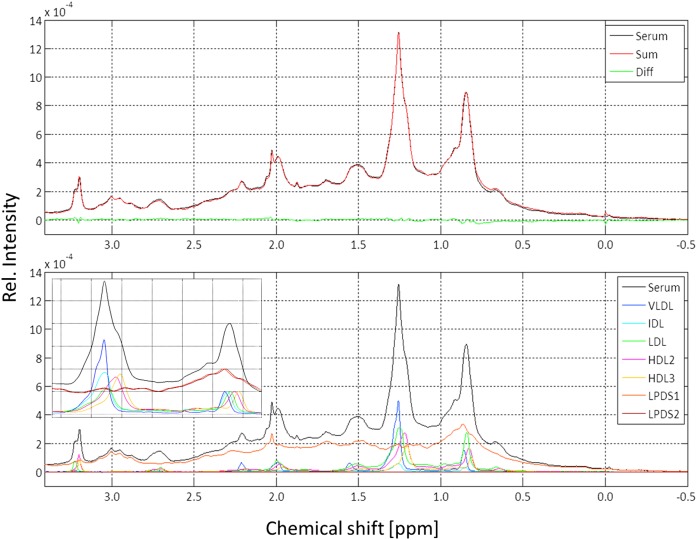
Fig. 2.
Reconstruction of a serum spectrum from its fractions obtained by sequential ultracentrifugation. All samples were transferred into extracellular buffer (45) as described in Materials and Methods. Only the highfield part of the 600 MHz 1H NMR spectrum is shown. Temperature was 310 K. Lines were broadened by applying an artificial line broadening of 2 Hz. Upper: Original serum spectrum (black) and synthetic spectrum calculated adding the appropriately weighted experimental spectra of the lipoprotein subfractions obtained by sequential ultracentrifugation of the same serum sample (red) and residual (green). Lower: All individual spectra that were added are shown with a color code indicated. (Insert) Methyl-methylene region of different subfractions. The intensity of the methyl signal was normalized here always to the same value. Diff., difference; Rel. relative.

