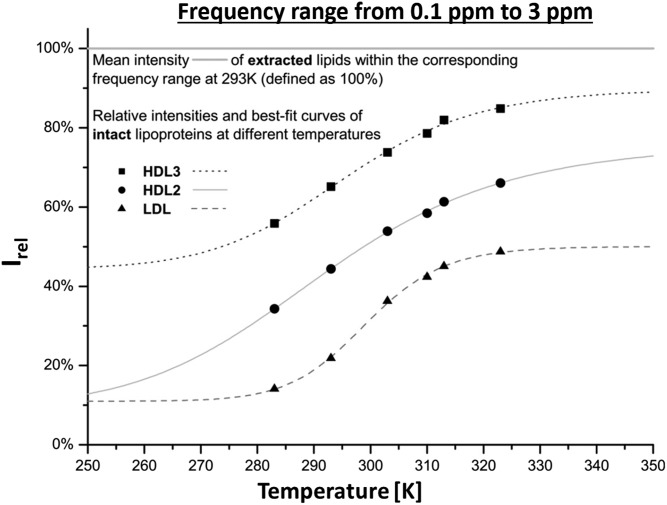
Fig. 5.
1H NMR signal enhancement as a function of temperature. The integrals Irel = ILP/ILipid from 0.1 to 3.0 ppm of the 1H NMR spectra of LDL, HDL2, and HDL3 are plotted in relation to the corresponding extracted lipid signal, which was defined as 100%. All lipoprotein subclasses show successive intensity increase along with the temperature, but do not reach the absolute lipid intensity of 100%. HDL3 gains about 90%, HDL2 75%, and LDL merely 50%. Irel was fitted with equation 8. The fit values are given in Table 4.

